What 73,977 AI Answers Reveal About Google AI Shopping’s Top Categories
This report analyzes 73,977 AI-generated answers to reveal how brands, SKUs, product attributes, subcategories, and purchase intent influence visibility in Google AI Shopping.
Track AI search visibilityNo install
Updated by
AI-assisted for research support
9 Min Read
Updated on Jul 29, 2026
1. Moving From Category Rankings to the Product Level
Dageno AI analyzed 73,977 AI-generated answers collected through the first half of 2026. The dataset covers 4,555 brands across 32 categories. Last week, we published an in-depth analysis of five key categories (read the previous report). In this report, we go one level deeper—examining leading product placements, subcategories, attribute and selling-point keywords, and long-tail prompts that sit closer to the purchase decision. The goal is to reveal the competitive dynamics that brand-level rankings alone cannot show.
Product-level data exposes a distinction that matters even more than the overall brand rankings. In some categories, a small number of brands dominate the top recommendations with multiple SKUs. In others, many different brands each secure a place with a single project-specific product. Brand visibility is only the starting point; ultimately, AI must select a specific product for a specific use case.
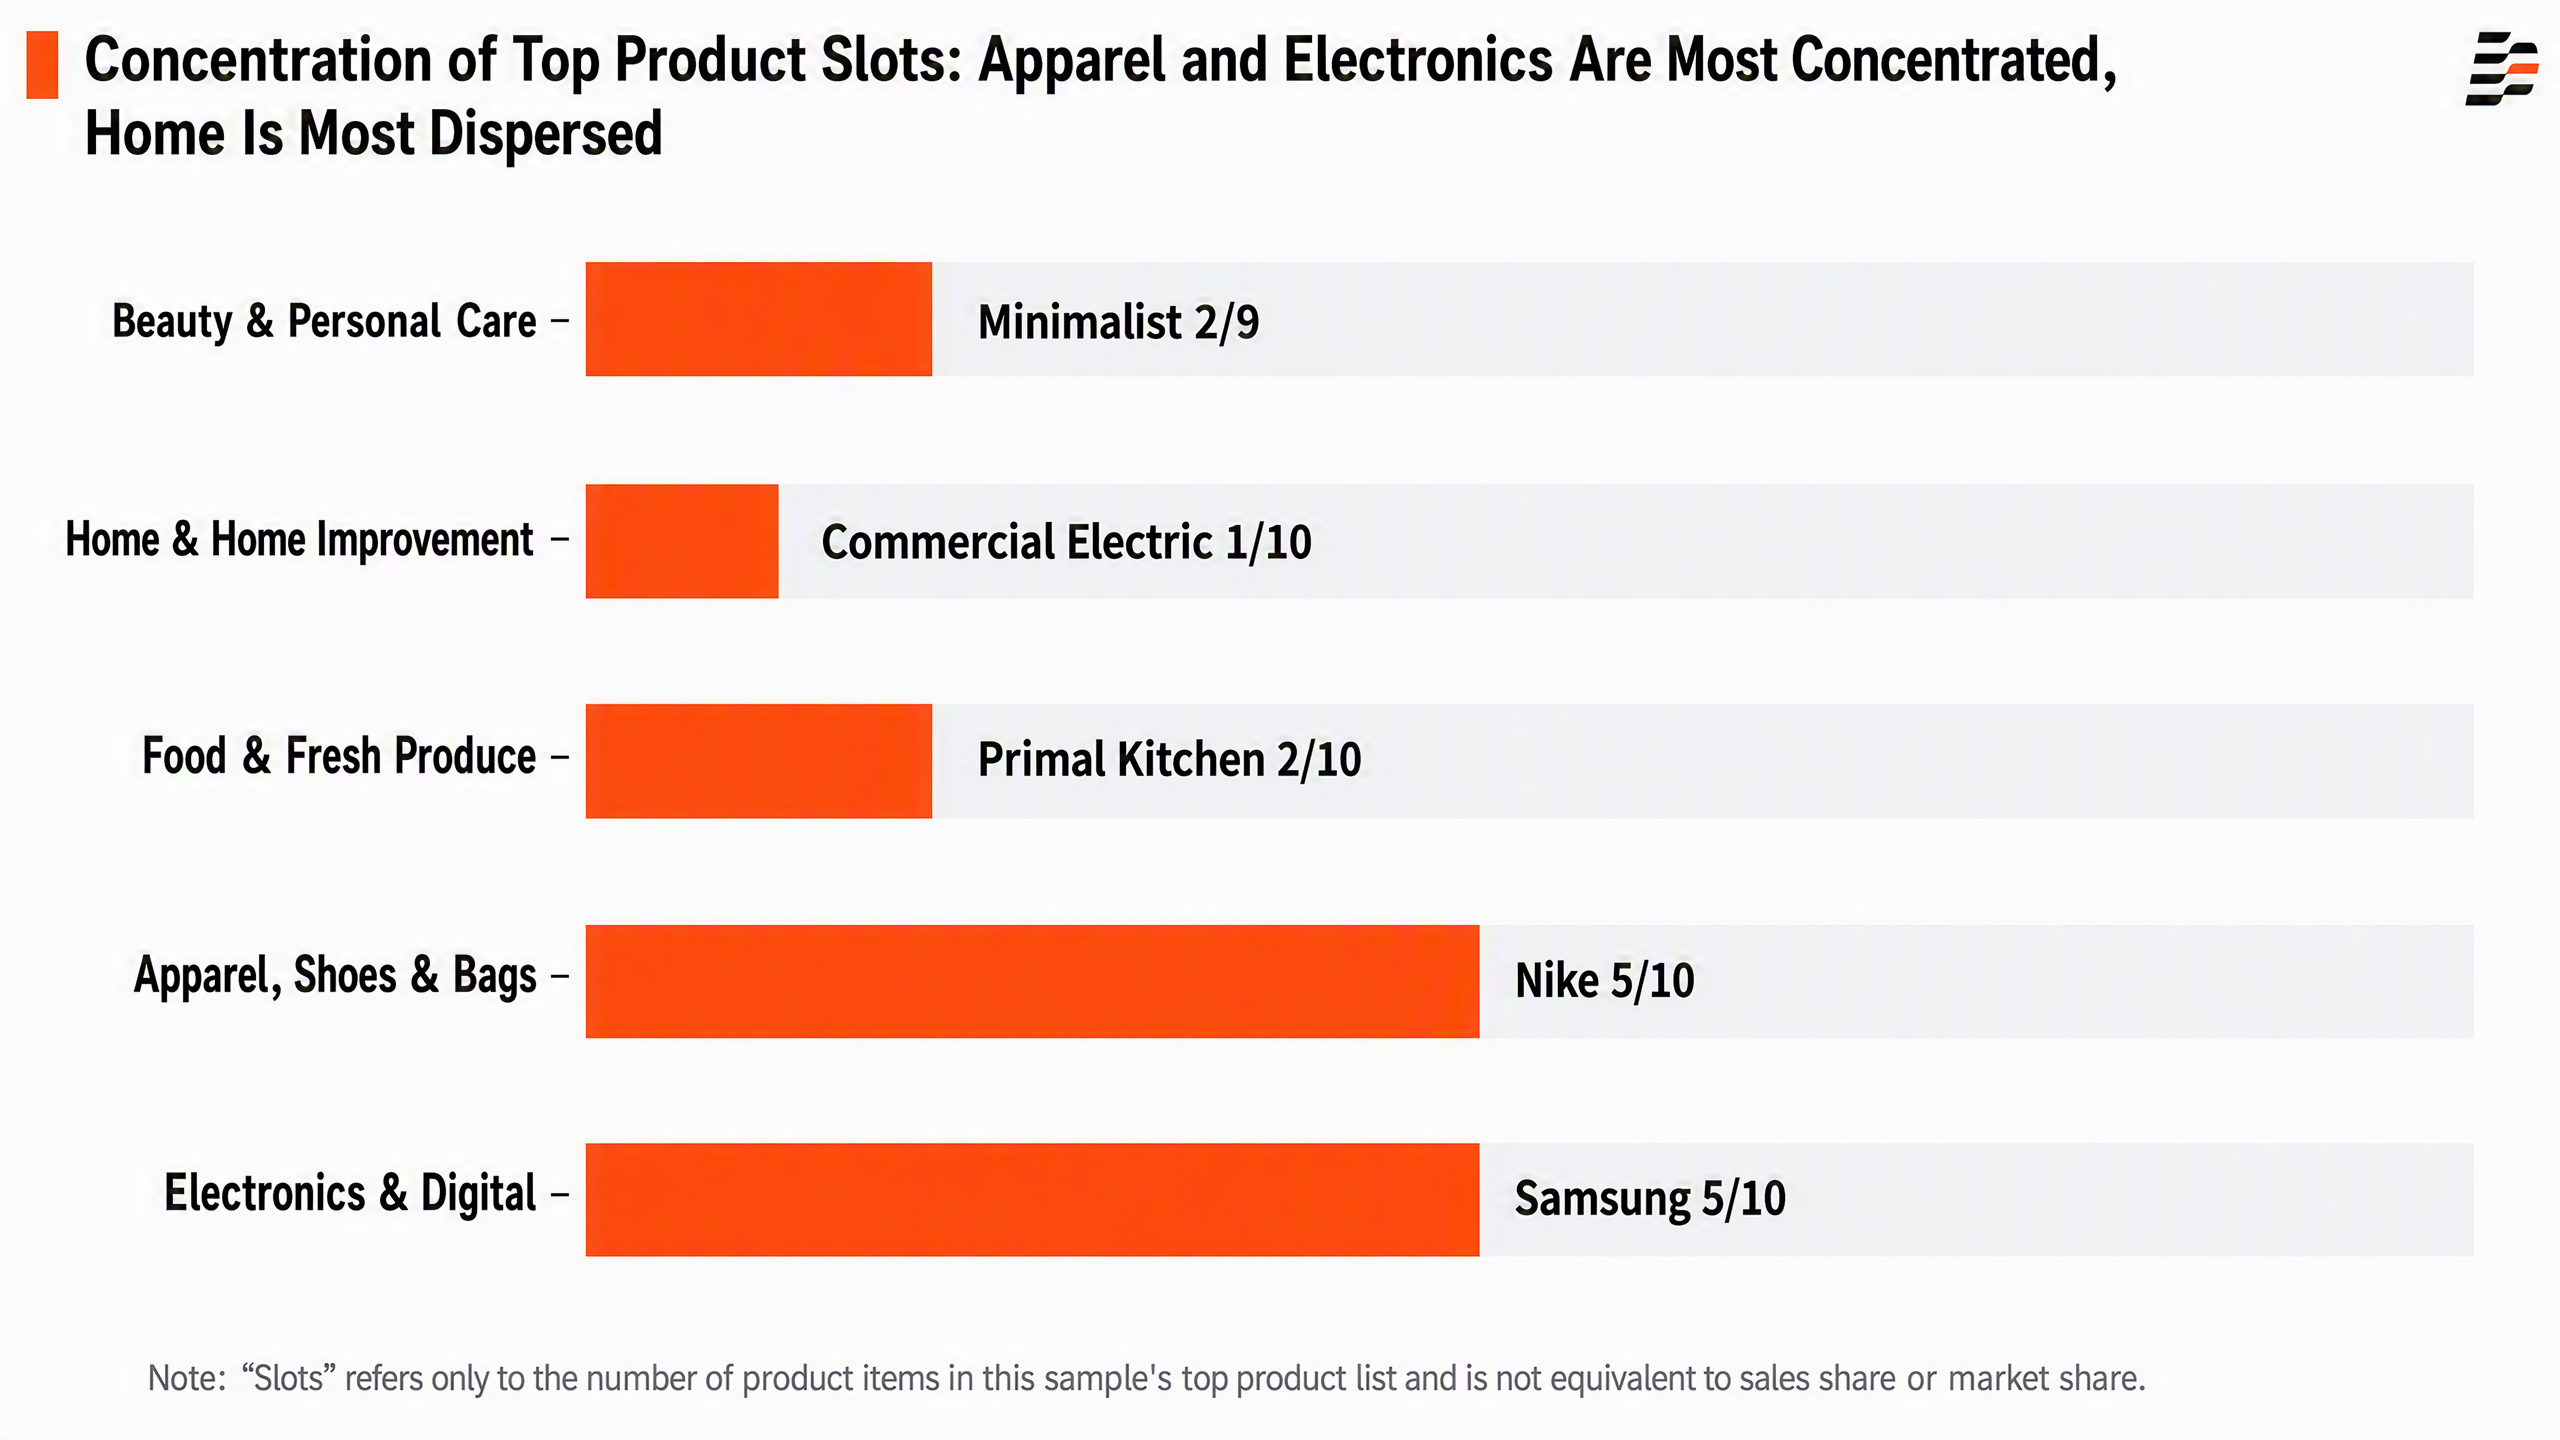
Figure 1. Concentration of leading product placements across the five key categories.
2. Leading Product Placements: Multi-SKU Dominance and Project-Based Fragmentation Coexist
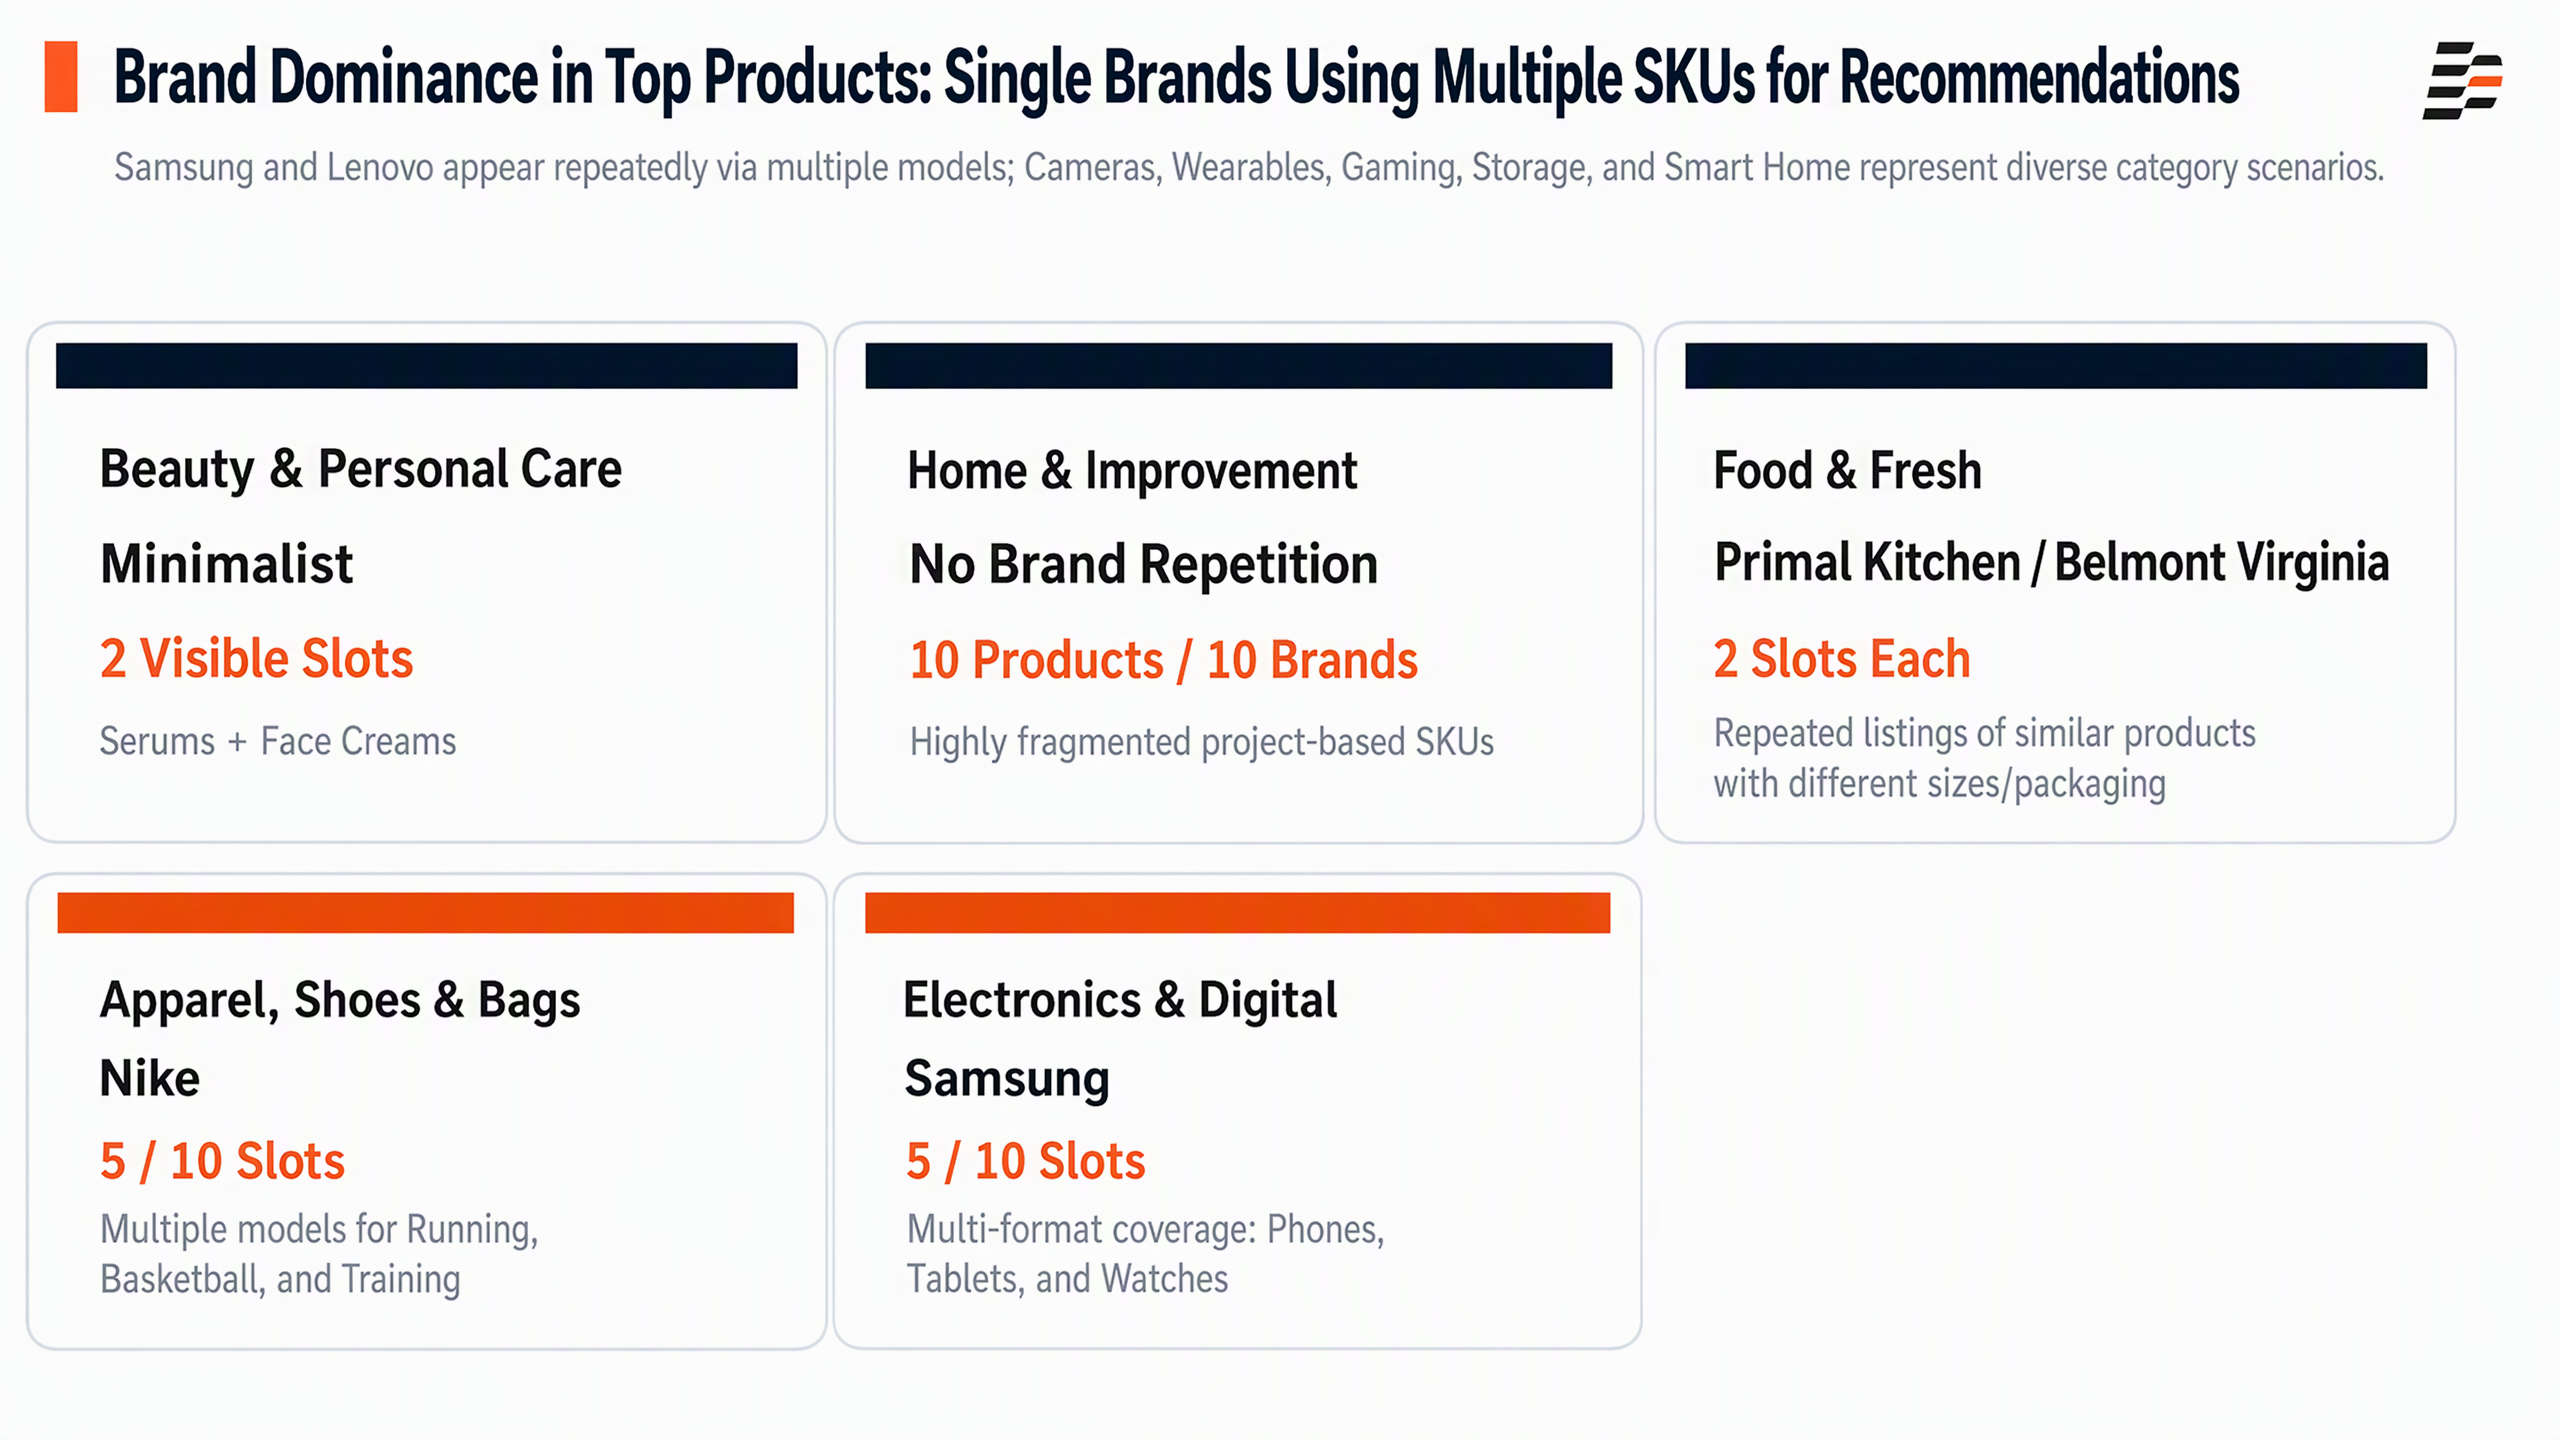
Figure 2. Brands occupying multiple placements among the leading products in the five key categories.
Apparel, footwear and accessories, along with consumer electronics, have the most concentrated product placements. Among the ten visible leading apparel products, Nike accounts for five and ASICS for two. In consumer electronics, Samsung accounts for five and Lenovo for three. In these two categories, brand strength is reflected not only in overall rankings but also in the repeated inclusion of multiple models and product formats in AI consideration sets.
Home and home improvement show the opposite pattern. The ten visible leading products come from ten different brands and span lighting, picture frames, patio heaters, office chairs, bioethanol fireplaces, and tiles. This category resembles project-based product selection more than brand domination. Specific specifications, installation requirements, room scenarios, and channel availability are more likely to change individual product rankings.
Beauty and food fall somewhere in between. Minimalist has two SKUs among the visible leading beauty products, while Primal Kitchen and Belmont Virginia each have two SKUs among the leading food products. In these categories, clearly structured product-family information, variant differentiation, and multi-SKU data directly affect whether AI recognizes products from the same brand as distinct solutions.
3. A Deep Dive Into Five Key Categories: SKUs, Subcategories, Attributes, and Purchase Intent
3.1 Beauty and Personal Care: Results-Driven Skincare and Haircare Hold Their Ground, While Deodorants and Fragrances Expand Demand Entry Points
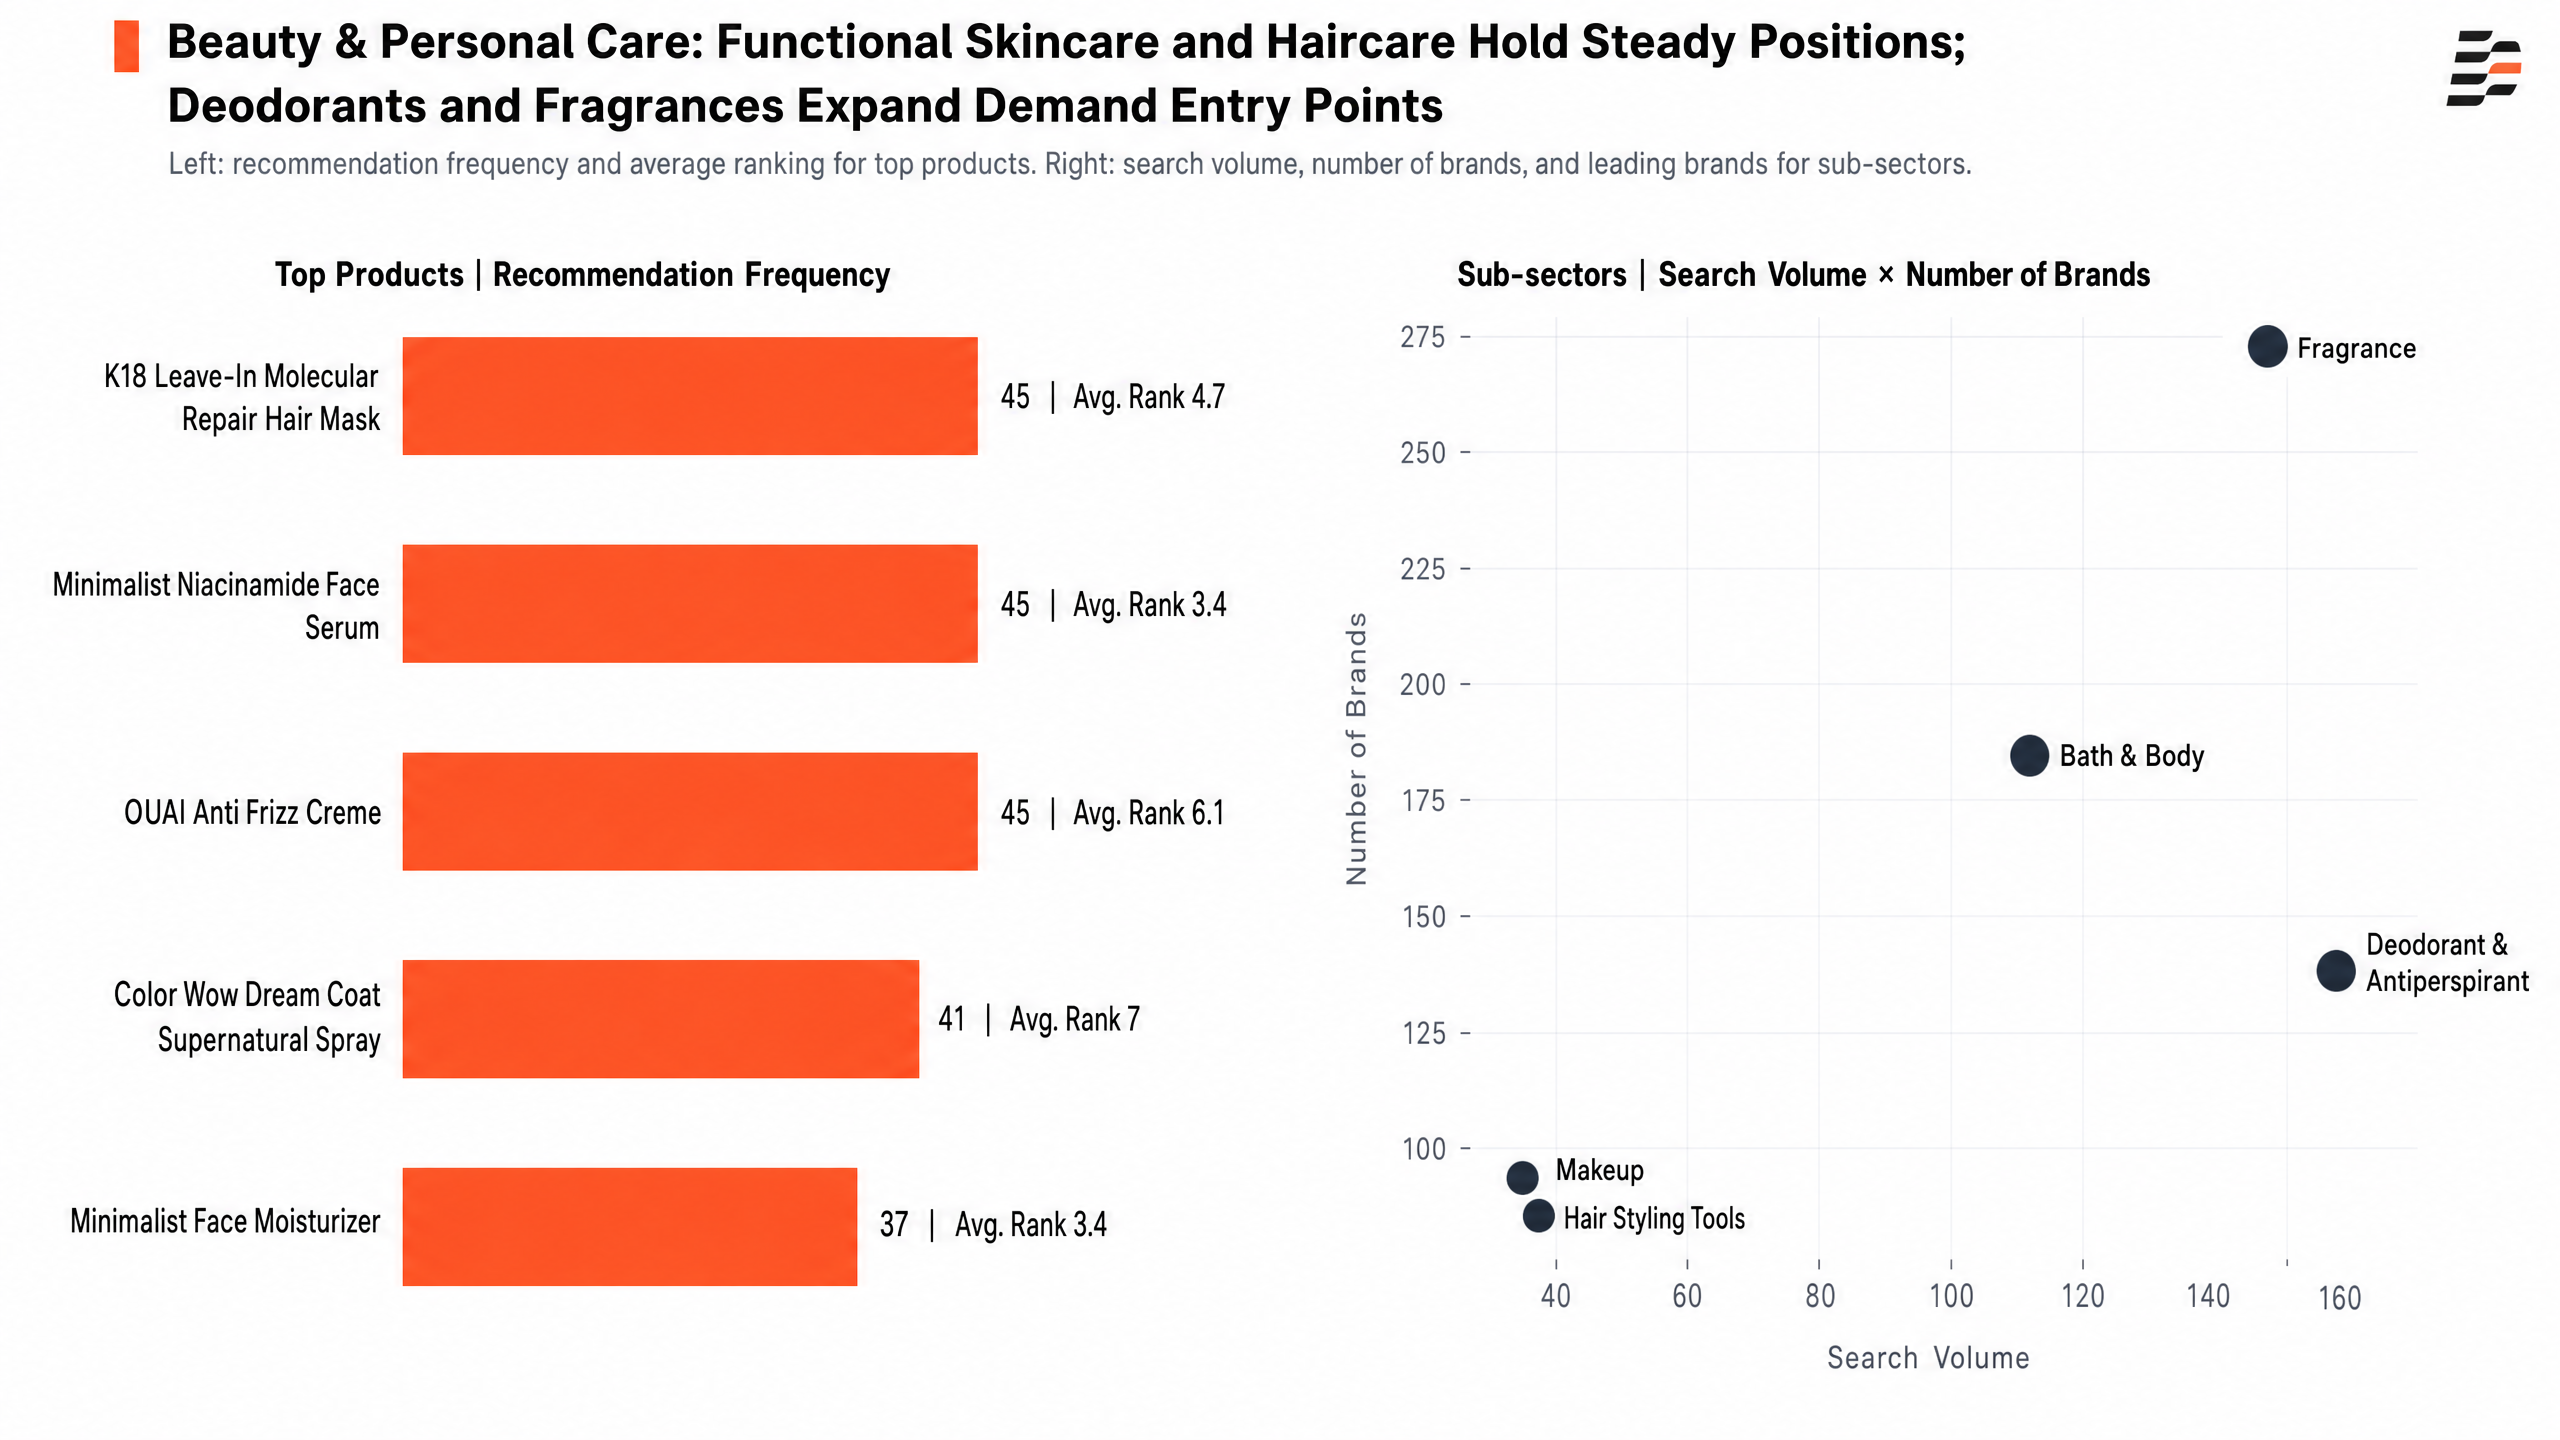
Figure 3. Additional leading products and subcategories in beauty and personal care.
K18, Minimalist, OUAI, and Color Wow all appear consistently among the broader set of leading products. The K18 hair mask, Minimalist niacinamide serum, and OUAI anti-frizz cream were each recommended 45 times, yet their average positions were 4.7, 3.4, and 6.1, respectively. This shows that recommendation frequency and ranking position are two separate dimensions.
Minimalist is particularly noteworthy. Both its niacinamide serum and face moisturizer achieved an average position of 3.4. Although their appearance rates were only 2.4% and 1.9%, respectively, they tended to rank near the top whenever they appeared. For results-driven brands, securing separate ingredient- or benefit-specific placements with multiple SKUs is more valuable than optimizing only one hero product.
| Product | Brand | Recommendations | Appearance Rate | Average Position |
|---|---|---|---|---|
| K18 Leave-In Molecular Repair Hair Mask | K18 | 45 | 2.4% | 4.7 |
| Minimalist Niacinamide Face Serum | Minimalist | 45 | 2.4% | 3.4 |
| OUAI Anti Frizz Creme | OUAI | 45 | 2.4% | 6.1 |
| Color Wow Dream Coat Supernatural Spray | Color Wow | 41 | 2.1% | 7.0 |
| Minimalist Face Moisturizer | Minimalist | 37 | 1.9% | 3.4 |
At the subcategory level, deodorants and antiperspirants generated 155 queries and involved 141 brands. Fragrances generated slightly fewer queries at 138, but the brand pool expanded to 273. Although the two have similar query volumes, their competitive structures differ significantly: fragrance has a much broader candidate pool, while deodorants and antiperspirants have a comparatively narrower one. Bath and body also reached 104 queries across 184 brands, showing that body care is far from a marginal demand segment.
| Product Subcategory | Leading AI-Recommended Brands | Query Volume | Number of Brands |
|---|---|---|---|
| Deodorants and antiperspirants | Dove / Degree / Native | 155 | 141 |
| Fragrances | Giorgio Armani / Yves Saint Laurent / Versace | 138 | 273 |
| Bath and body | Dove / Naturium / Aveeno | 104 | 184 |
| Hair styling tools | Conair / BaBylissPRO / Shark | 35 | 90 |
| Makeup | e.l.f. / Morphe / ILIA | 33 | 97 |
Attribute and selling-point keywords reshuffle brand rankings. Minimalist leads for “niacinamide” and “salicylic acid,” Olaplex for “curly hair care,” CeraVe for “sensitive skin” and “anti-frizz,” and Dove for “antiperspirant” and “aluminum-free.” Overall brand rankings therefore cannot replace competitive analysis at the attribute-keyword level.
| Attribute/Keyword | No. 1 Brand (Coverage) | Other Frequently Mentioned Brands |
|---|---|---|
| Sulfate-free | L'Oréal Paris (57) | Dove 14; CeraVe 7 |
| Niacinamide | Minimalist (54) | Plum 27; Moroccanoil 20; Pilgrim 19 |
| Salicylic acid | Minimalist (52) | Cetaphil 6 |
| Curly hair care | Olaplex (52) | Amika 2; Moroccanoil 2 |
| Sensitive skin | CeraVe (48) | Not Your Mother's 19 |
| Anti-frizz | CeraVe (47) | Kérastase 15 |
| Antiperspirant | Dove (44) | Native 26 |
| Aluminum-free | Dove (40) | — |
Long-tail purchase intent has already entered the transaction stage. “Where to buy” reached a coverage score of 102, followed by “premium/best-in-class” at 19, “how much does it cost” at 15, and “how to choose/recommendations” at 12. Beauty content must go beyond benefit education and clearly explain purchasing channels, price tiers, alternatives, and selection criteria.
| Long-Tail Prompt | Coverage |
|---|---|
| Where to buy / where can I get it? | 102 |
| Premium / best-in-class | 19 |
| How much does it cost? | 15 |
| How to choose / recommendations | 12 |
| Which one should I choose? | 11 |
| Dupes / alternatives | 8 |
| Is it good / is it worth it? | 8 |
3.2 Home and Home Improvement: The Same Appearance Rate Does Not Mean the Same Ranking Position
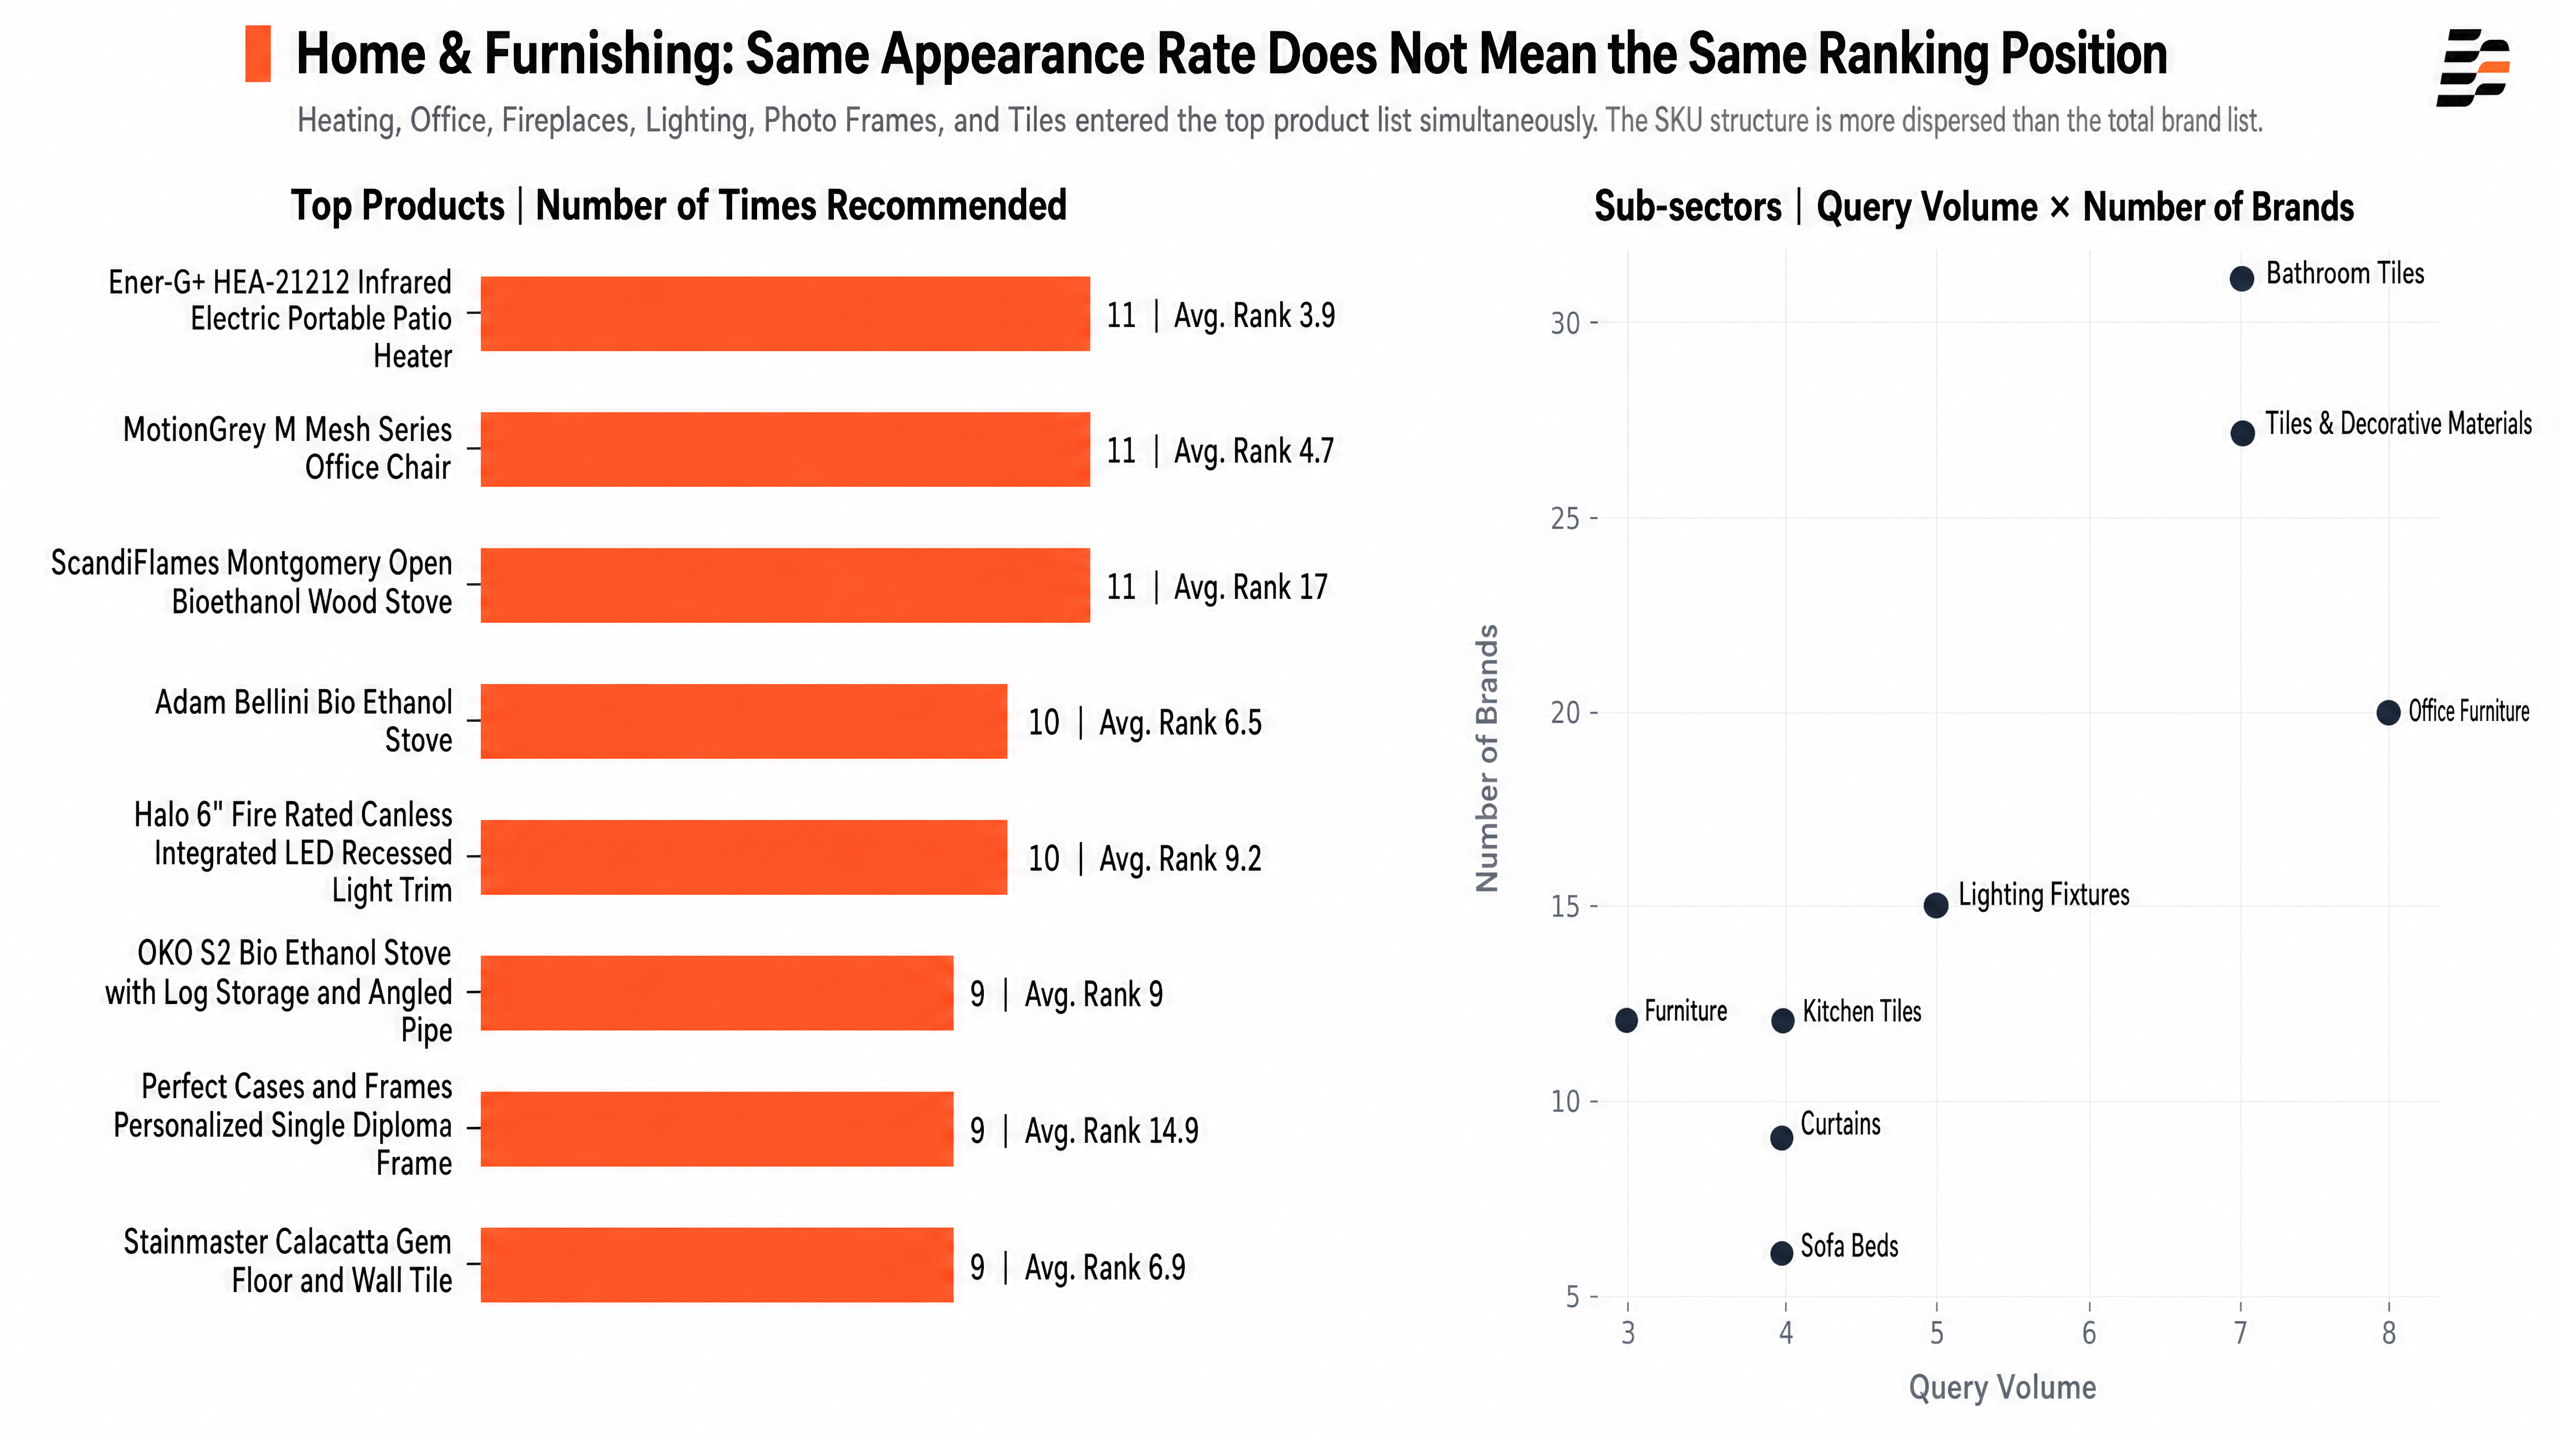
Figure 4. Additional leading products and subcategories in home and home improvement.
The leading home products span a wide range of categories. The Ener-G+ patio heater, MotionGrey office chair, and ScandiFlames bioethanol stove were each recommended 11 times and each had an appearance rate of 4.7%. Their average positions, however, were 3.9, 4.7, and 17.0, respectively. The same retrieval frequency can therefore correspond to very different ranking performance.
The personalized frame from Perfect Cases and Frames was recommended nine times with an average position of 14.9. Stainmaster tile was also recommended nine times, but achieved an average position of 6.9. For home products, increasing the number of AI mentions is not enough. Complete specifications, suitability for a project, channel availability, and on-page evidence determine whether a product appears near the front or the back of the shortlist.
| Product | Brand | Recommendations | Appearance Rate | Average Position |
|---|---|---|---|---|
| Ener-G+ HEA-21212 Infrared Electric Portable Patio Heater | Ener-G+ | 11 | 4.7% | 3.9 |
| MotionGrey M Mesh Series Office Chair | MotionGrey | 11 | 4.7% | 4.7 |
| ScandiFlames Montgomery Open Bioethanol Wood Stove | ScandiFlames | 11 | 4.7% | 17.0 |
| Adam Bellini Bio Ethanol Stove | Adam | 10 | 4.3% | 6.5 |
| Halo 6" Fire Rated Canless Integrated LED Recessed Light Trim | Halo | 10 | 4.3% | 9.2 |
| OKO S2 Bio Ethanol Stove with Log Storage and Angled Pipe | OKO | 9 | 3.9% | 9.0 |
| Perfect Cases and Frames Personalized Single Diploma Frame | Perfect Cases and Frames | 9 | 3.9% | 14.9 |
| Stainmaster Calacatta Gem Floor and Wall Tile | Stainmaster | 9 | 3.9% | 6.9 |
Subcategories split further around tiles, lighting, and furniture. Bathroom tile (7 queries / 31 brands), tile and decorative materials (7 / 27), and kitchen tile (4 / 12) all coexist. Lighting is likewise divided into lighting fixtures, commercial lighting, LED lighting, smart lighting, and other labels. To users, these may look like closely related needs; to AI, they can represent different retrieval entry points.
| Product Subcategory | Leading AI-Recommended Brands | Query Volume | Number of Brands |
|---|---|---|---|
| Office furniture | Bestier / Bestar / Tribesigns | 8 | 20 |
| Bathroom tile | Satori / MSI / Merola Tile | 7 | 31 |
| Tile and decorative materials | MSI / Sunwings / Merola Tile | 7 | 27 |
| Lighting fixtures | Lithonia / Lithonia Lighting / Kichler | 5 | 15 |
| Curtains | Sun Zero / Mainstays / Elrene | 4 | 9 |
| Sofa beds | IKEA / Freedom Dream / Rivercity House & Home Co | 4 | 6 |
| Kitchen tile | MSI / Bodesi / Apollo Tile | 4 | 12 |
| Furniture | Morden Fort / Radley / Ashley | 3 | 12 |
At the attribute level, specification terms such as “LED,” “ultra-thin,” “dimmable,” “adjustable color temperature,” and “recessed” map directly to lighting selection. “Polished” and “matte” reshuffle tile brands. If these specifications appear only in product images, AI will struggle to extract and compare them consistently.
| Attribute/Keyword | No. 1 Brand (Coverage) | Other Frequently Mentioned Brands |
|---|---|---|
| LED | Lithonia Lighting (18) | Maxxima 16; IKEA 4; Feit Electric 4; Sunco 4 |
| Commercial | Maxxima (15) | Stainmaster 3; Sunco 4 |
| Ultra-thin | Maxxima (14) | — |
| Adjustable color temperature | Feit Electric (14) | — |
| Dimmable | Lithonia Lighting (12) | — |
| Recessed | Maxxima (12) | Lithonia Lighting 2 |
| Polished | MSI / Ivy Hill Tile (11) | Apollo Tile 4; Bedrosians 4; Daltile 2 |
| Matte | Bedrosians / Stainmaster (11) | MSI 10; Apollo Tile 5; Satori 3 |
Among long-tail prompts, “where to buy” reached a coverage score of 31, exceeding “how much does it cost” at 6 and “where can I get this done locally” at 5. Transaction information and local service details have a clear presence in this category, especially for products involving installation, measurement, delivery, or construction projects.
| Long-Tail Prompt | Coverage |
|---|---|
| Where to buy / where can I get it? | 31 |
| How much does it cost? | 6 |
| Where can I get this done locally? | 5 |
| What types are available? | 4 |
| Alternatives / substitutes | 2 |
| Which one should I choose? | 2 |
3.3 Food and Grocery: Multiple SKUs, Packaging, and Flavor Variants Become Independent Units of Competition
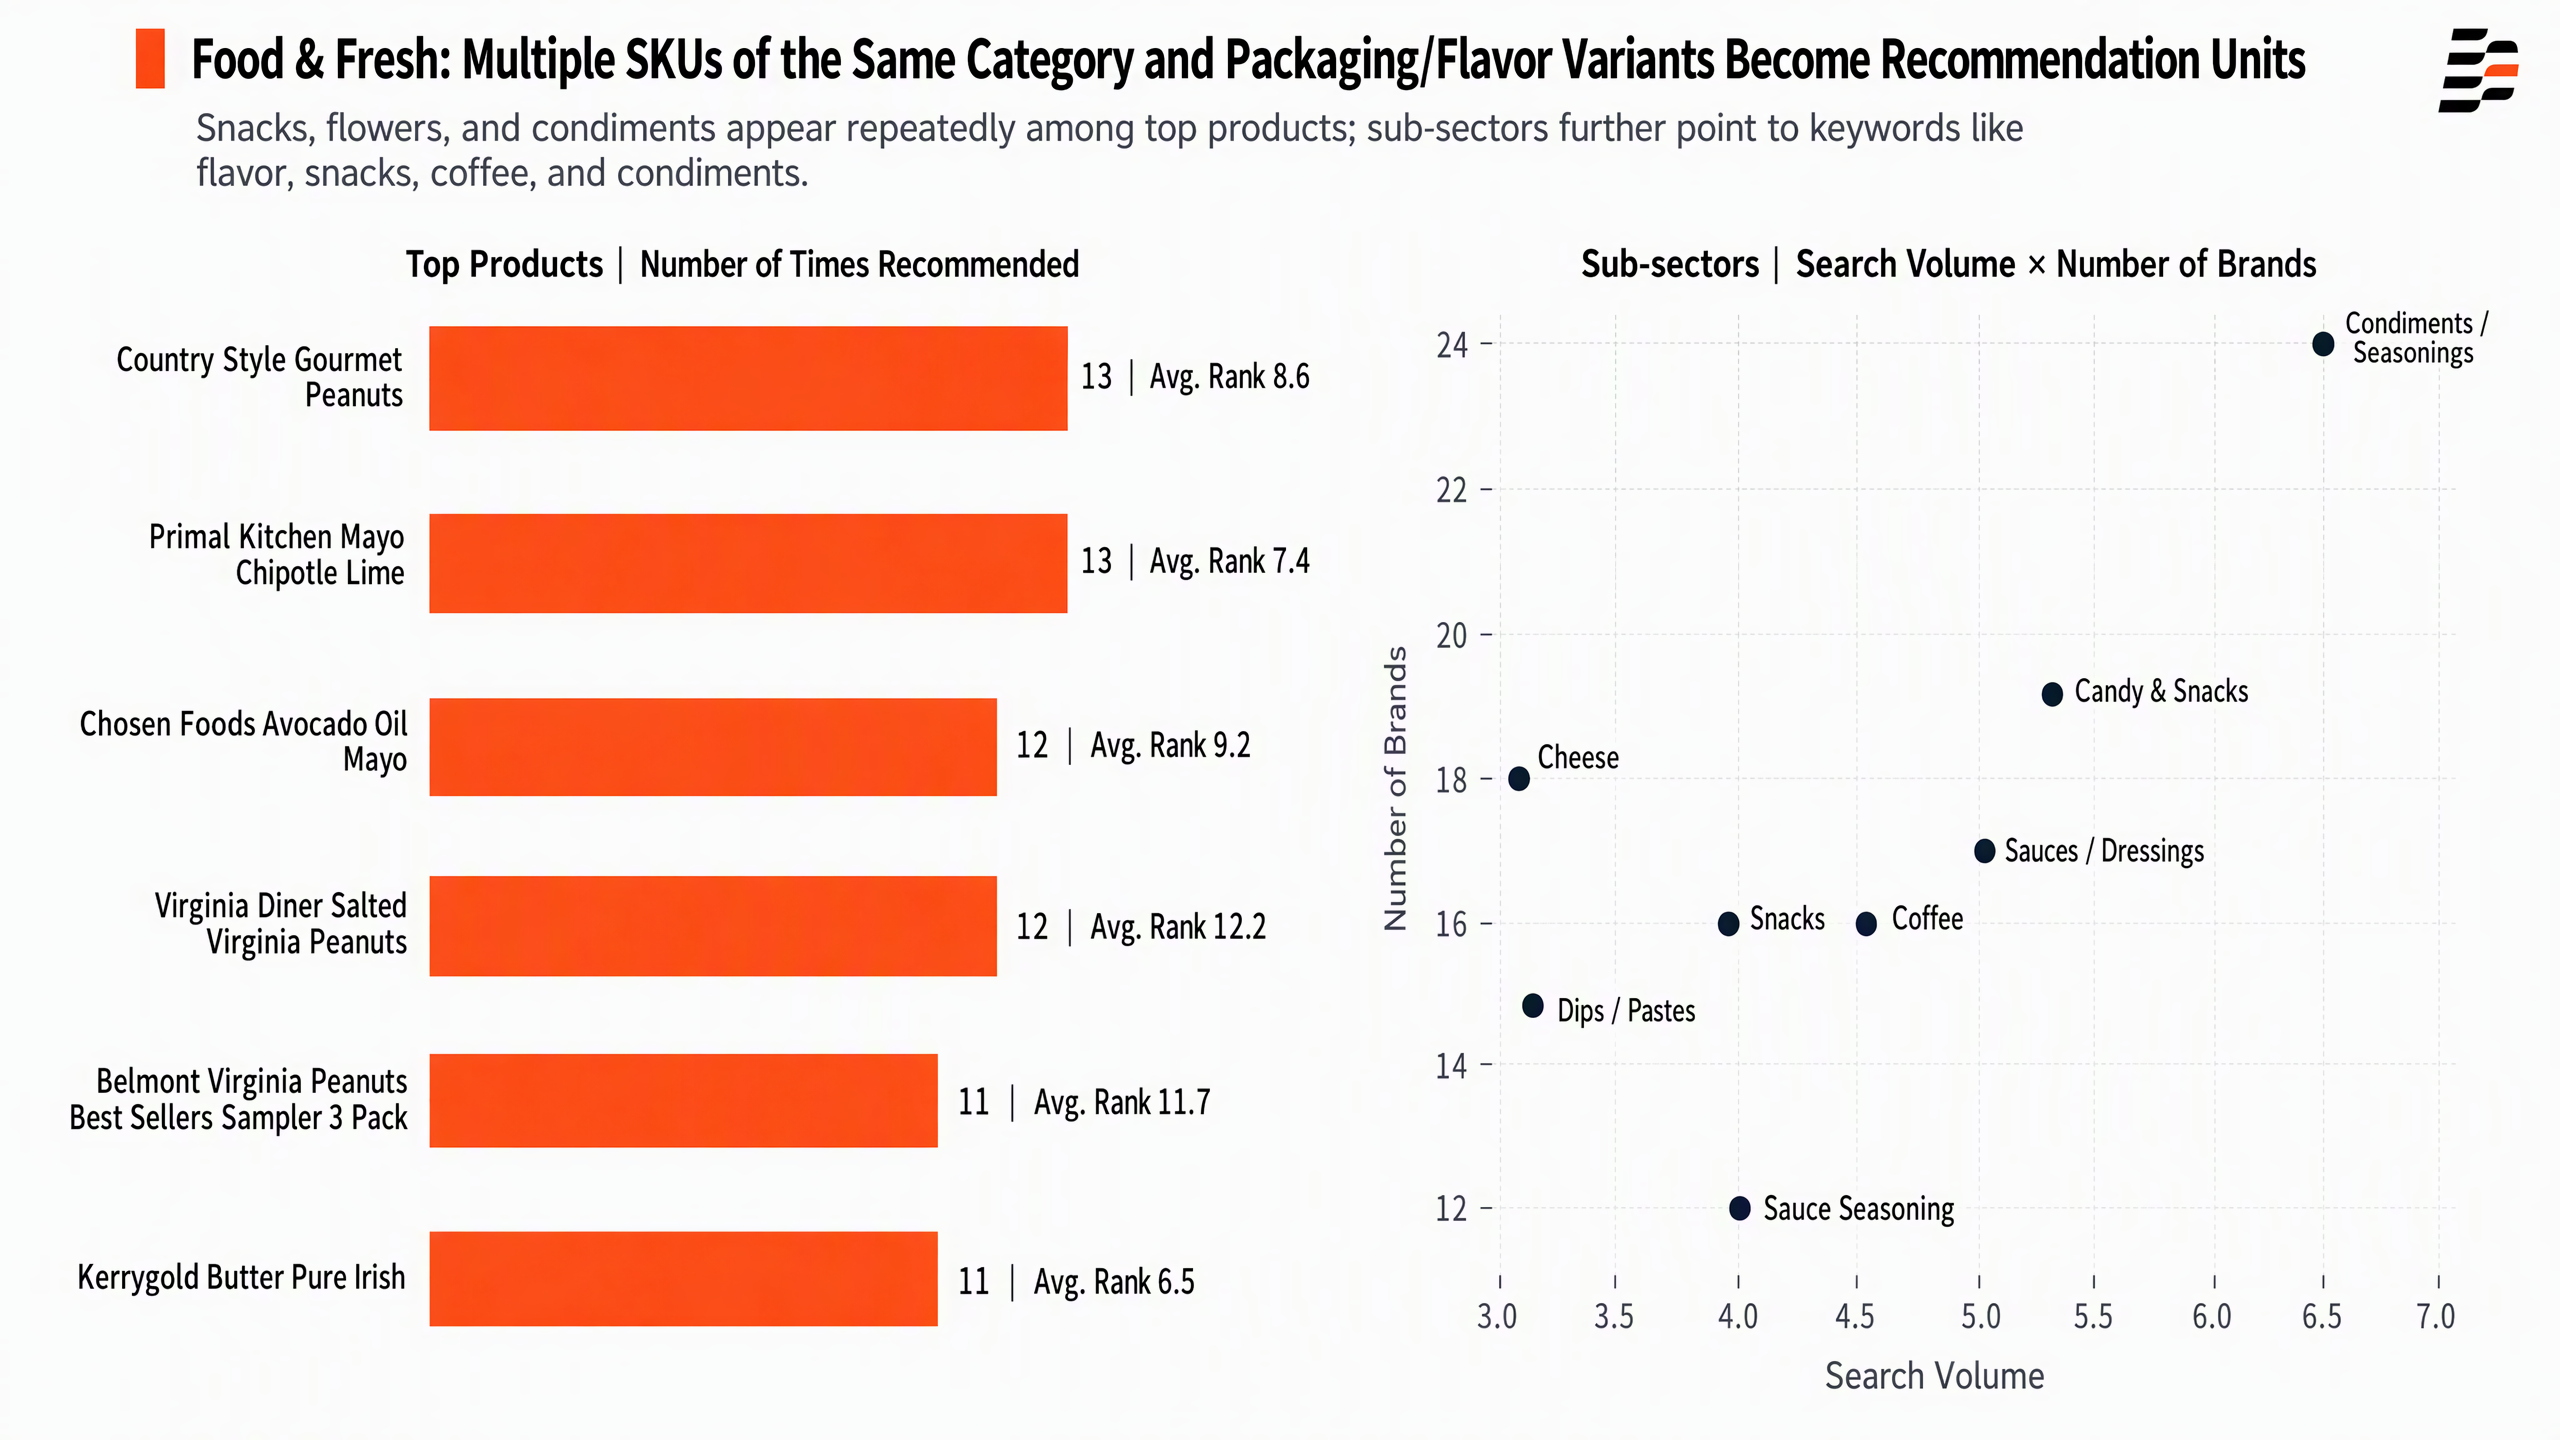
Figure 5. Additional leading products and subcategories in food and grocery.
Among the leading food products, peanuts, mayonnaise, and butter form clear clusters of repeated product types. Primal Kitchen appears with two different mayonnaise SKUs, while Belmont Virginia appears twice with six-pack and three-pack peanut gift-box variants. This suggests that AI treats flavor, packaging, and product-line variants as independent candidates.
Kerrygold Butter Pure Irish was recommended 11 times with an appearance rate of 6.1%. Its average position of 6.5 was better than that of Country Style peanuts (8.6) and Chosen Foods mayonnaise (9.2), despite those products being recommended more often. In food, high recommendation frequency and a high ranking position do not always move in lockstep.
| Product | Brand | Recommendations | Appearance Rate | Average Position |
|---|---|---|---|---|
| Country Style Gourmet Peanuts | Country Style | 13 | 7.3% | 8.6 |
| Primal Kitchen Mayo Chipotle Lime | Primal Kitchen | 13 | 7.3% | 7.4 |
| Chosen Foods Avocado Oil Mayo | Chosen Foods | 12 | 6.7% | 9.2 |
| Virginia Diner Salted Virginia Peanuts | Virginia Diner | 12 | 6.7% | 12.2 |
| Belmont Virginia Peanuts Best Sellers Sampler 3 Pack | Belmont Virginia | 11 | 6.1% | 11.7 |
| Kerrygold Butter Pure Irish | Kerrygold | 11 | 6.1% | 6.5 |
Subcategory labels become increasingly fragmented around condiments and snacks. Seasonings, condiment sauces, sauce seasonings, and sauces all appear as separate labels, as do snacks and candy snacks. The labels in Dageno's monitored source data are not completely standardized either. Brands should therefore cover synonyms, closely related terms, and different product formats in their content systems instead of betting on a single canonical category term.
| Product Subcategory | Leading AI-Recommended Brands | Query Volume | Number of Brands |
|---|---|---|---|
| Seasonings | Heinz / Poon's London / Tiptree Wilkin & Sons | 7 | 24 |
| Candy and sweets | Bubs / Dylan's Candy Bar / BUBS Godis | 5 | 19 |
| Condiment sauces | Hellmann's / Guy Fieri / Heinz | 5 | 17 |
| Snacks | CraveBox / Utz / LesserEvil | 4 | 15 |
| Sauces and seasonings | President's Choice / Lee Kum Kee / Kikkoman | 4 | 11 |
| Coffee | Laird Superfood / VitaCup / Bulletproof | 4 | 16 |
| Cheese | Boar's Head / Kraft / Borden | 3 | 18 |
| Sauces | Tiptree / Chef's Menu / Hammond's | 3 | 15 |
Among attributes and selling points, Knorr leads for “low sodium,” Kerrygold for “natural,” Cabot for “sea salt,” and Kraft for “sliced.” Recommendation placements in food are closely tied to dietary attributes, processing methods, and packaging formats. Brand awareness alone cannot cover all of these needs.
| Attribute/Keyword | No. 1 Brand (Coverage) | Other Frequently Mentioned Brands |
|---|---|---|
| Bulk | Dooboe (19) | — |
| Canola oil | Land O Lakes (19) | — |
| Sea salt | Cabot (18) | Tillamook 5; Land O Lakes 4 |
| Salted butter | Hellmann's (17) | Vital Farms 4 |
| Low sodium | Knorr (15) | — |
| Sticks | Plugra (15) | Cabot 4; Land O Lakes 3; Kerrygold 3 |
| Natural | Kerrygold (14) | Tillamook 3 |
| Sliced | Kraft (14) | Land O Lakes 2 |
For long-tail transactional intent, “where to buy” reached a coverage score of 78. “What is this?” followed at 17, “premium/best-in-class” at 6, and “what types are available” at 5. Food content must establish product availability while also explaining ingredients, category definitions, usage, and differences in quality.
| Long-Tail Prompt | Coverage |
|---|---|
| Where to buy / where can I get it? | 78 |
| What is this? | 17 |
| Premium / best-in-class | 6 |
| What types are available? | 5 |
| Alternatives / substitutes | 2 |
| Which one should I choose? | 2 |
| Where can I get this done locally? | 1 |
| How it works / industry trends | 1 |
3.4 Apparel, Footwear, and Accessories: Brands Are Concentrated, but Specific Models and Athletic Functions Determine Rankings
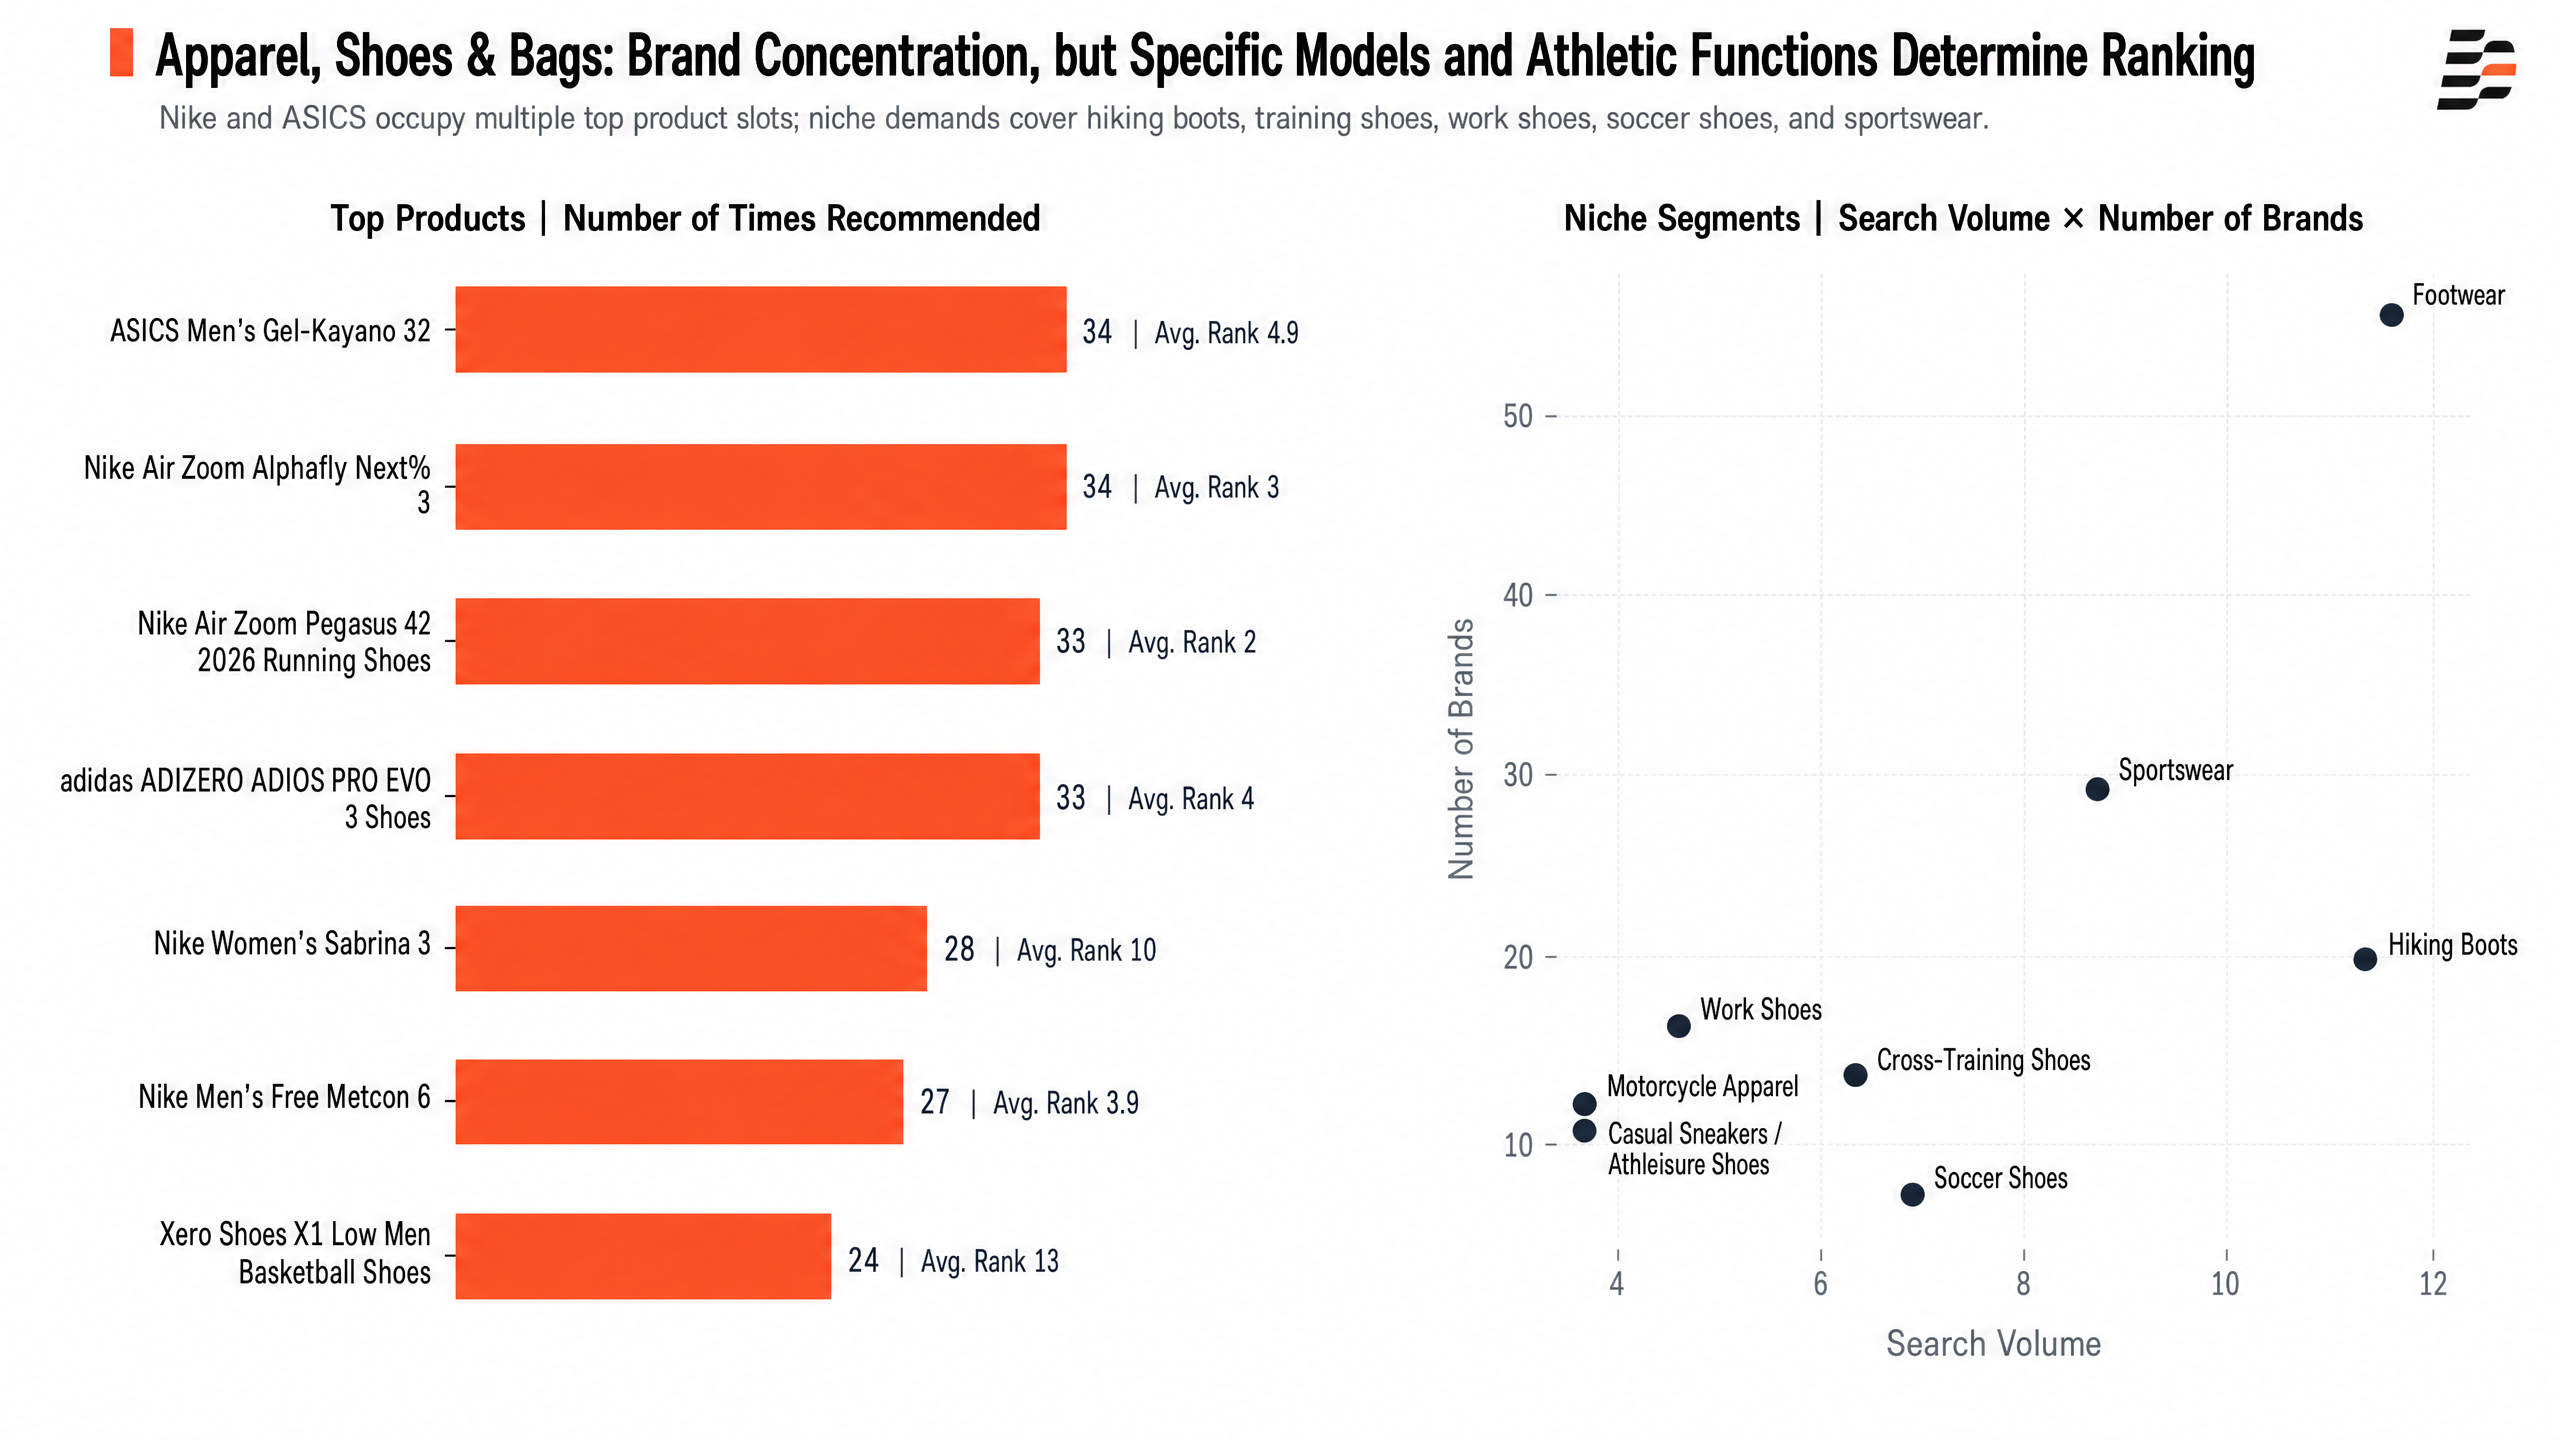
Figure 6. Additional leading products and subcategories in apparel, footwear, and accessories.
Apparel has the highest concentration among leading products. Nike accounts for five of the ten visible leading products, while ASICS accounts for two. More importantly, different models serve different scenarios: Alphafly is designed for racing, Pegasus for everyday running, Free Metcon for training, and Sabrina for basketball. Brand strength is amplified through a portfolio of models.
Among the broader set of leading products, the Nike Air Zoom Pegasus 42 was recommended 33 times, achieved an appearance rate of 7.3%, and reached an average position of 2.0. The Alphafly Next% 3 achieved an average position of 3.0. By comparison, the Xero Shoes X1 Low was recommended 24 times but averaged only 13.0. In apparel and footwear, model-to-use-case fit and evidence supporting functional claims can significantly affect rankings.
| Product | Brand | Recommendations | Appearance Rate | Average Position |
|---|---|---|---|---|
| ASICS Men's Gel-Kayano 32 | ASICS | 34 | 7.5% | 4.9 |
| Nike Air Zoom Alphafly Next% 3 | Nike | 34 | 7.5% | 3.0 |
| Nike Air Zoom Pegasus 42 2026 Running Shoes | Nike | 33 | 7.3% | 2.0 |
| adidas ADIZERO ADIOS PRO EVO 3 Shoes | adidas | 33 | 7.3% | 4.0 |
| Nike Women's Sabrina 3 | Nike | 28 | 6.2% | 10.0 |
| Nike Men's Free Metcon 6 | Nike | 27 | 6.0% | 3.9 |
| Xero Shoes X1 Low Men Basketball Shoes | Xero Shoes | 24 | 5.3% | 13.0 |
Subcategories cover specific needs such as hiking boots, athletic apparel, soccer cleats, cross-training shoes, and work shoes. Soccer cleats generated seven queries but involved only eight brands, while the broader “footwear” category generated 12 queries across 57 brands. Candidate-pool breadth differs significantly by subcategory, so concentration at the overall category level is not automatically replicated in every functional segment.
| Product Subcategory | Leading AI-Recommended Brands | Query Volume | Number of Brands |
|---|---|---|---|
| Footwear | Nike / Vionic / adidas | 12 | 57 |
| Hiking boots | KEEN / Columbia / Merrell | 11 | 20 |
| Athletic apparel | Under Armour / Nike / Vuori | 9 | 29 |
| Soccer cleats | adidas / Mizuno / Nike | 7 | 8 |
| Cross-training shoes | Nike / Reebok / Flux | 6 | 14 |
| Work shoes | Skechers / Crocs / KURU | 4 | 16 |
| Casual sneakers | adidas / Puma / Skechers | 3 | 11 |
| Motorcycle apparel | REV'IT! / Alpinestars / SEDICI | 3 | 12 |
Attribute keywords can give brands outside the top overall ranking a competitive advantage. ASICS leads for “cushioning” and “neutral arch,” Salomon for “GTX waterproof,” Skechers for “steel toe/slip-resistant,” and adidas for “professional racing.” Functional specifications are a critical entry point for reshuffling apparel and footwear rankings.
| Attribute/Keyword | No. 1 Brand (Coverage) | Other Frequently Mentioned Brands |
|---|---|---|
| Basketball shoes | Skechers (110) | adidas 9; Nike 9; Way of Wade 9 |
| Cushioning | ASICS (35) | — |
| Neutral arch | ASICS (35) | — |
| Wide fit | Nike (34) | — |
| Professional racing | adidas (33) | — |
| Low-top | Xero Shoes (24) | Nike 11; adidas 8; Salomon 7; Under Armour 9 |
| GTX waterproof | Salomon (15) | Columbia 4 |
| Steel toe / slip-resistant | Skechers (14) | — |
Among long-tail apparel prompts, “where to buy” scored 11, “how it works/industry trends” 7, “which one should I choose” 5, and “how to choose/recommendations” 4. Although the coverage of these prompts is much lower than that of scenario-based questions, they sit closer to comparison, purchase, and expert judgment. Model comparisons, sport-specific guides, and sizing and fit advice are well suited to capturing this demand.
| Long-Tail Prompt | Coverage |
|---|---|
| Where to buy / where can I get it? | 11 |
| How it works / industry trends | 7 |
| Which one should I choose? | 5 |
| How to choose / recommendations | 4 |
| What are the pros and cons? | 2 |
| Premium / best-in-class | 1 |
| Compare these two—which is better? | 1 |
| What types are available? | 1 |
3.5 Consumer Electronics: Concentration at Both the Brand and Product-Line Levels
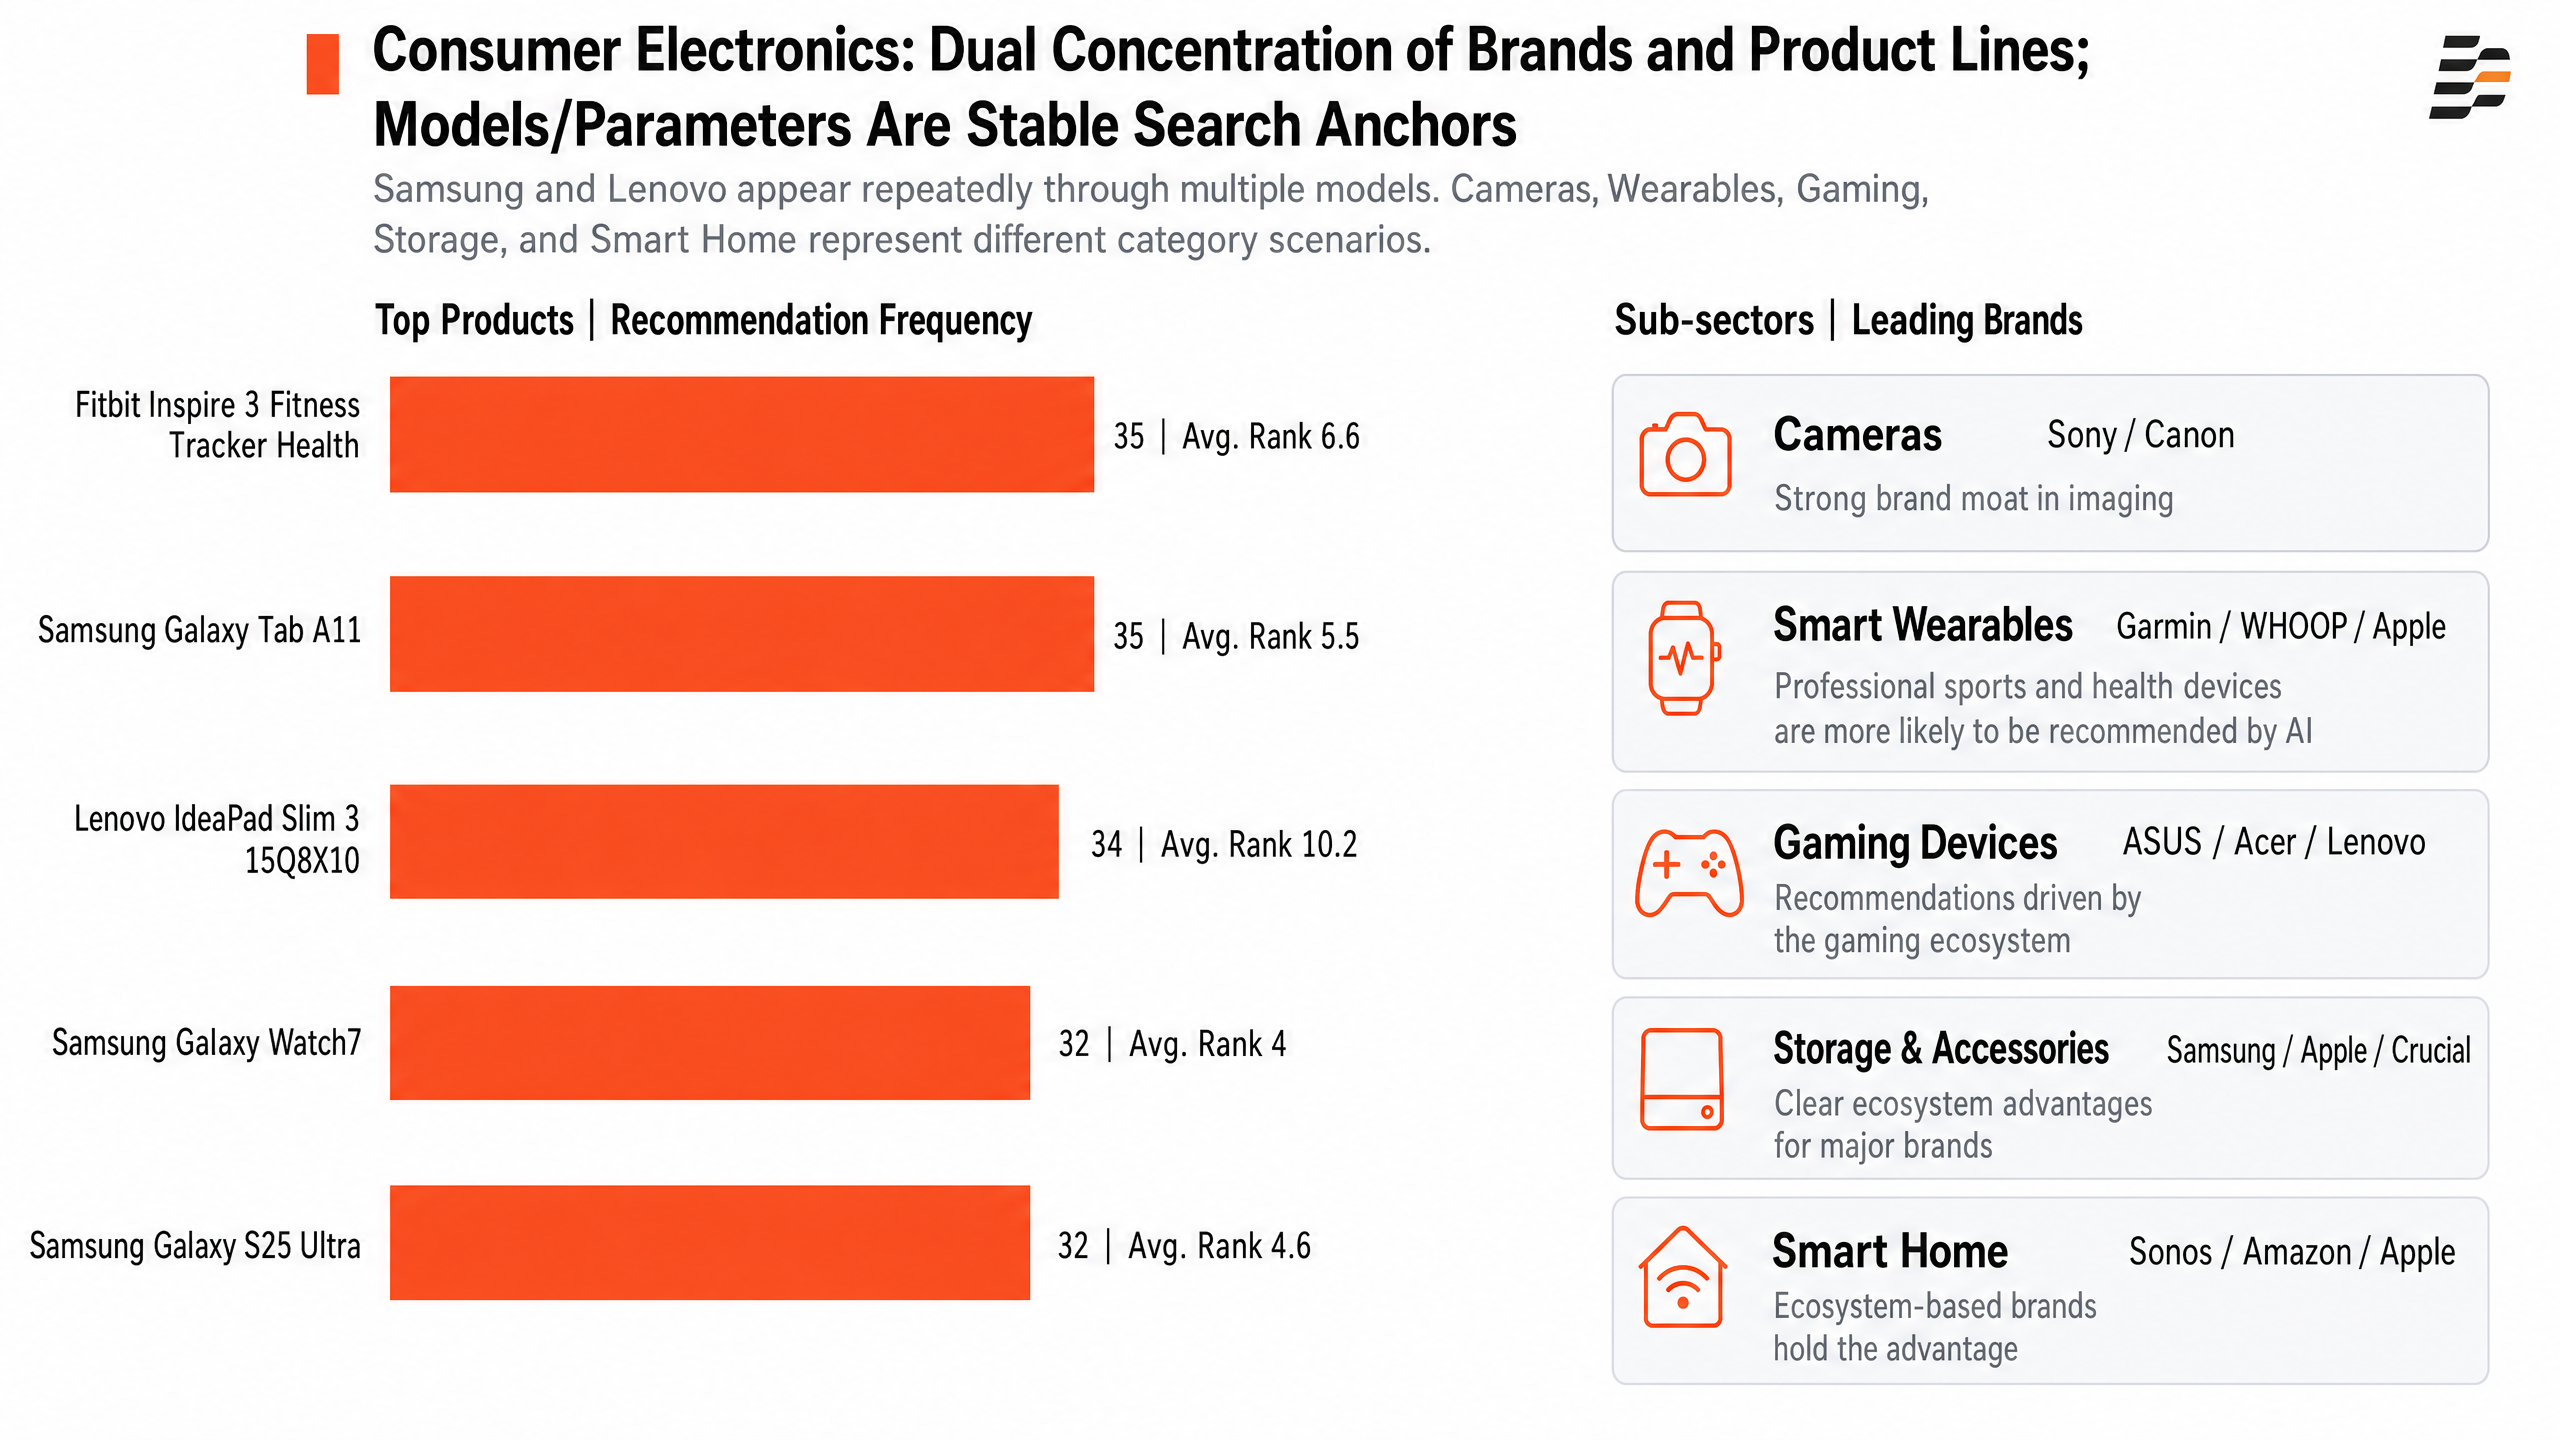
Figure 7. Additional leading products and subcategories in consumer electronics.
Among the ten visible leading consumer electronics products, Samsung accounts for five and Lenovo for three. Samsung spans smartphones, tablets, and watches, while Lenovo secures multiple placements through several IdeaPad Slim 3 variants. AI consideration sets are clearly organized not only by brand, but also by product line, model, and device format.
The Samsung Galaxy Watch7 and Galaxy S25 Ultra were each recommended 32 times with an appearance rate of 9.4%; their average positions were 4.0 and 4.6, respectively. The Lenovo IdeaPad Slim 3 15Q8X10 was recommended 34 times with an appearance rate of 10.0%, yet its average position was 10.2. Frequent retrieval of a model does not guarantee a leading position in the answer.
| Product | Brand | Recommendations | Appearance Rate | Average Position |
|---|---|---|---|---|
| Fitbit Inspire 3 Fitness Tracker Health | Fitbit | 35 | 10.3% | 6.6 |
| Samsung Galaxy Tab A11 | Samsung | 35 | 10.3% | 5.5 |
| Lenovo IdeaPad Slim 3 15Q8X10 | Lenovo | 34 | 10.0% | 10.2 |
| Samsung Galaxy Watch7 | Samsung | 32 | 9.4% | 4.0 |
| Samsung Galaxy S25 Ultra | Samsung | 32 | 9.4% | 4.6 |
Different subcategories form distinct brand ecosystems. Cameras are led by Sony and Canon; wearables by Garmin, WHOOP, and Apple; gaming devices by ASUS, Acer, and Lenovo; storage and accessories by Samsung, Apple, and Crucial; and smart home products by Sonos, Amazon, and Apple. The source data does not provide query volume or brand counts for these subcategories, so no scale comparison is made.
| Product Subcategory | Leading Brands | Source-Data Observation |
|---|---|---|
| Cameras | Sony / Canon | Imaging brands have a strong competitive moat |
| Wearables | Garmin / WHOOP / Apple | AI more readily recommends specialized sports and health devices |
| Gaming devices | ASUS / Acer / Lenovo | Gaming-laptop ecosystems drive recommendations |
| Storage and accessories | Samsung / Apple / Crucial | Major-brand ecosystem advantages are evident |
| Smart home | Sonos / Amazon / Apple | Ecosystem-driven brands lead |
Consumer electronics attributes and keywords combine technical specifications with product-line names. Chromebook, Copilot+ PC, MacBook Air, Surface Pro, thin-and-light laptops, OLED, Intel Core, and touchscreen all have high coverage. To AI, model families, operating-system formats, processors, and display technologies are all strong retrieval anchors.
| Attribute/Product-Line Keyword | No. 1 Brand (Coverage) | Other Frequently Mentioned Brands |
|---|---|---|
| Copilot+ PC | Microsoft (161) | — |
| Chromebook | Lenovo (151) | ASUS 12; Dell 4 |
| MacBook Air | Apple (139) | — |
| Surface Pro | Microsoft (139) | — |
| Thin-and-light laptop | Lenovo (138) | Dell 28 |
| OLED | Samsung (131) | ASUS 12; Dell 4; Sony 3; Lenovo 3 |
| Intel Core | Acer (129) | ASUS 20; Dell 15; Lenovo 6 |
| Touchscreen | Dell (126) | Lenovo 21; ASUS 9; Acer 9; Microsoft 2 |
Long-tail intent in consumer electronics is more comparison- and judgment-oriented than in other categories. “Which one should I choose?” scored 9, “where to buy” 8, “how much does it cost” 6, “compare these two” 5, and “is it good/is it worth it” 5. The more standardized the specifications, the more likely users are to ask AI for direct side-by-side comparisons.
| Long-Tail Prompt | Coverage |
|---|---|
| Which one should I choose? | 9 |
| Where to buy / where can I get it? | 8 |
| How much does it cost? | 6 |
| Compare these two—which is better? | 5 |
| Is it good / is it worth it? | 5 |
| Can it meet my requirements? | 4 |
| What types are available? | 4 |
| Premium / best-in-class | 3 |
| Alternatives / substitutes | 3 |
| How to choose / recommendations | 3 |
4. Long-Tail Purchase Intent: From “What Should I Buy?” to “Where, How, and at What Price?”
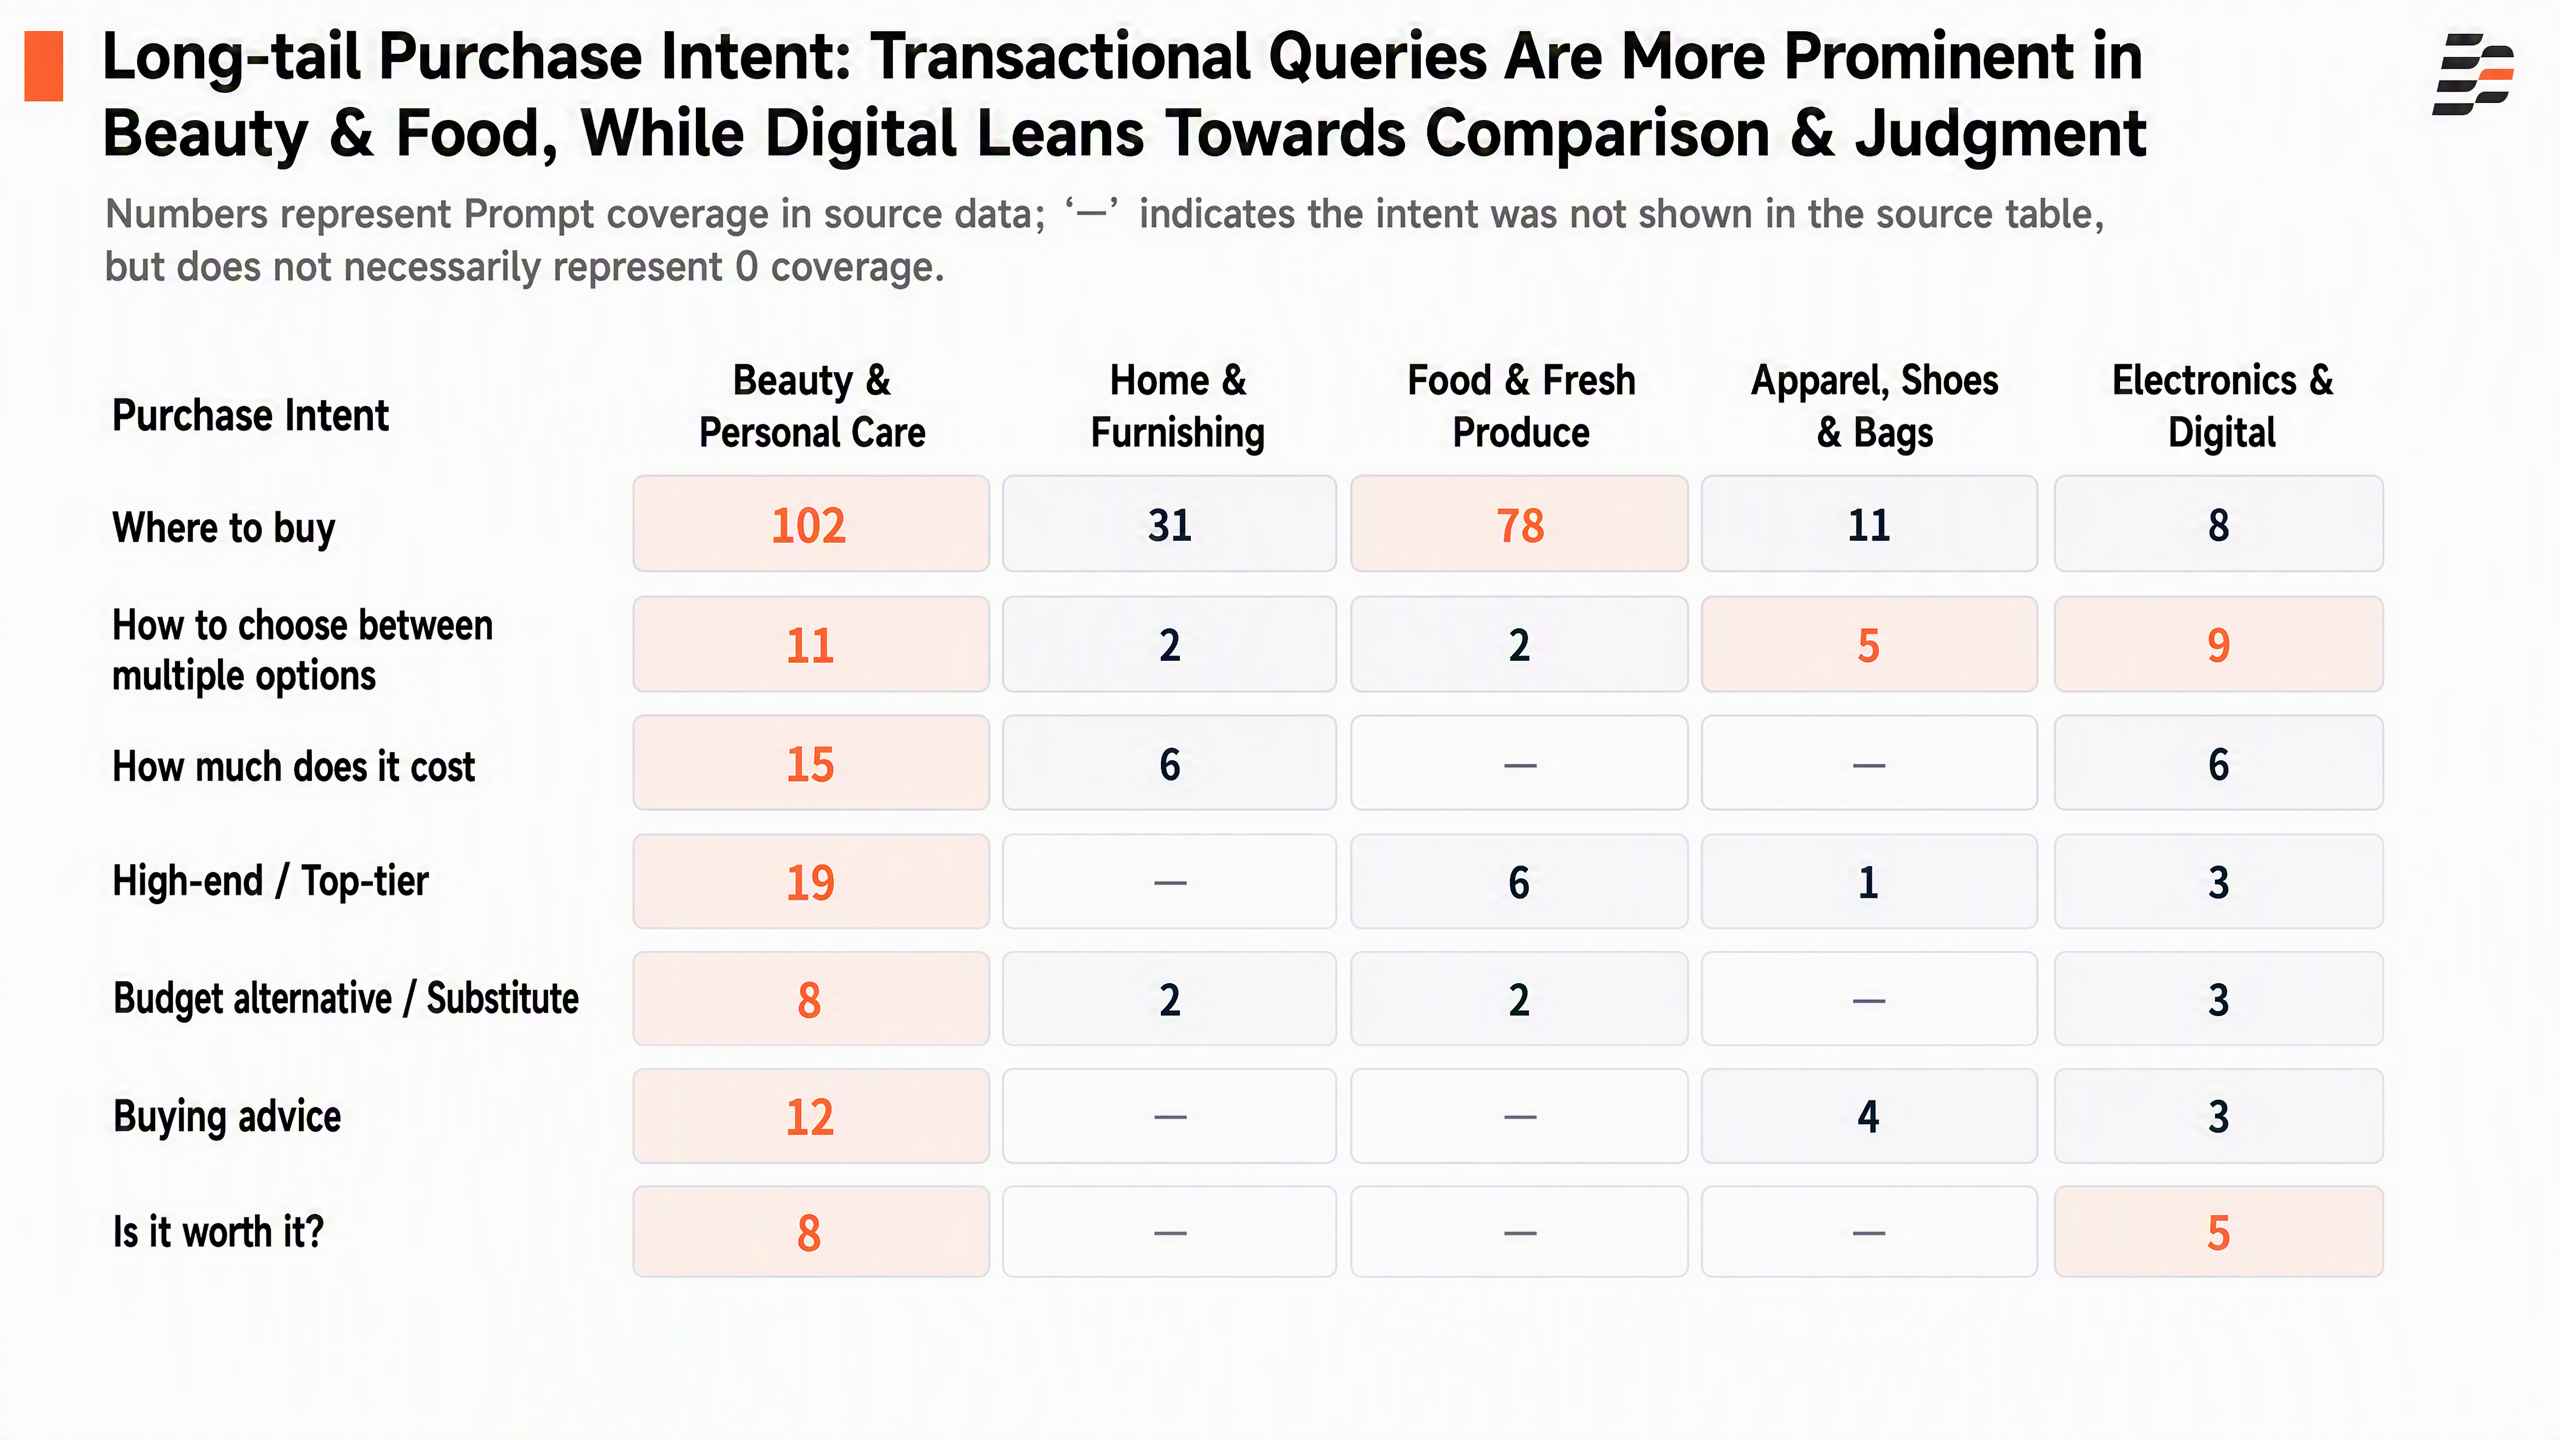
Figure 8. Long-tail purchase-intent coverage across the five key categories.
“Where to buy” is the clearest transactional long-tail intent, with coverage scores of 102 in beauty, 78 in food, and 31 in home. In these three categories, AI recommendations must do more than explain which product is better. They must also tell users whether the product is available, where they can buy it, and whether inventory and sales channels are reliable.
Consumer electronics follow a different pattern. “Which one should I choose?” scored 9, exceeding “where to buy” at 8. “How much does it cost?” scored 6, while “compare these two” and “is it worth it?” each scored 5. Standardized specifications and model naming make electronics naturally suited to side-by-side comparisons. Brands need to keep specifications, versions, and offer information consistent or risk losing ground at the comparison stage.
Transactional long-tail coverage is lower overall in apparel, but “industry trends” at 7, “which one should I choose?” at 5, and “buying advice” at 4 still create valuable entry points for expert content. Categories should not use the same GEO template simply because they all fall under Shopping. The evidence users require varies substantially from one category to another.
5. Subcategories With Large Numbers of Identified Brands Beyond the Five Key Categories
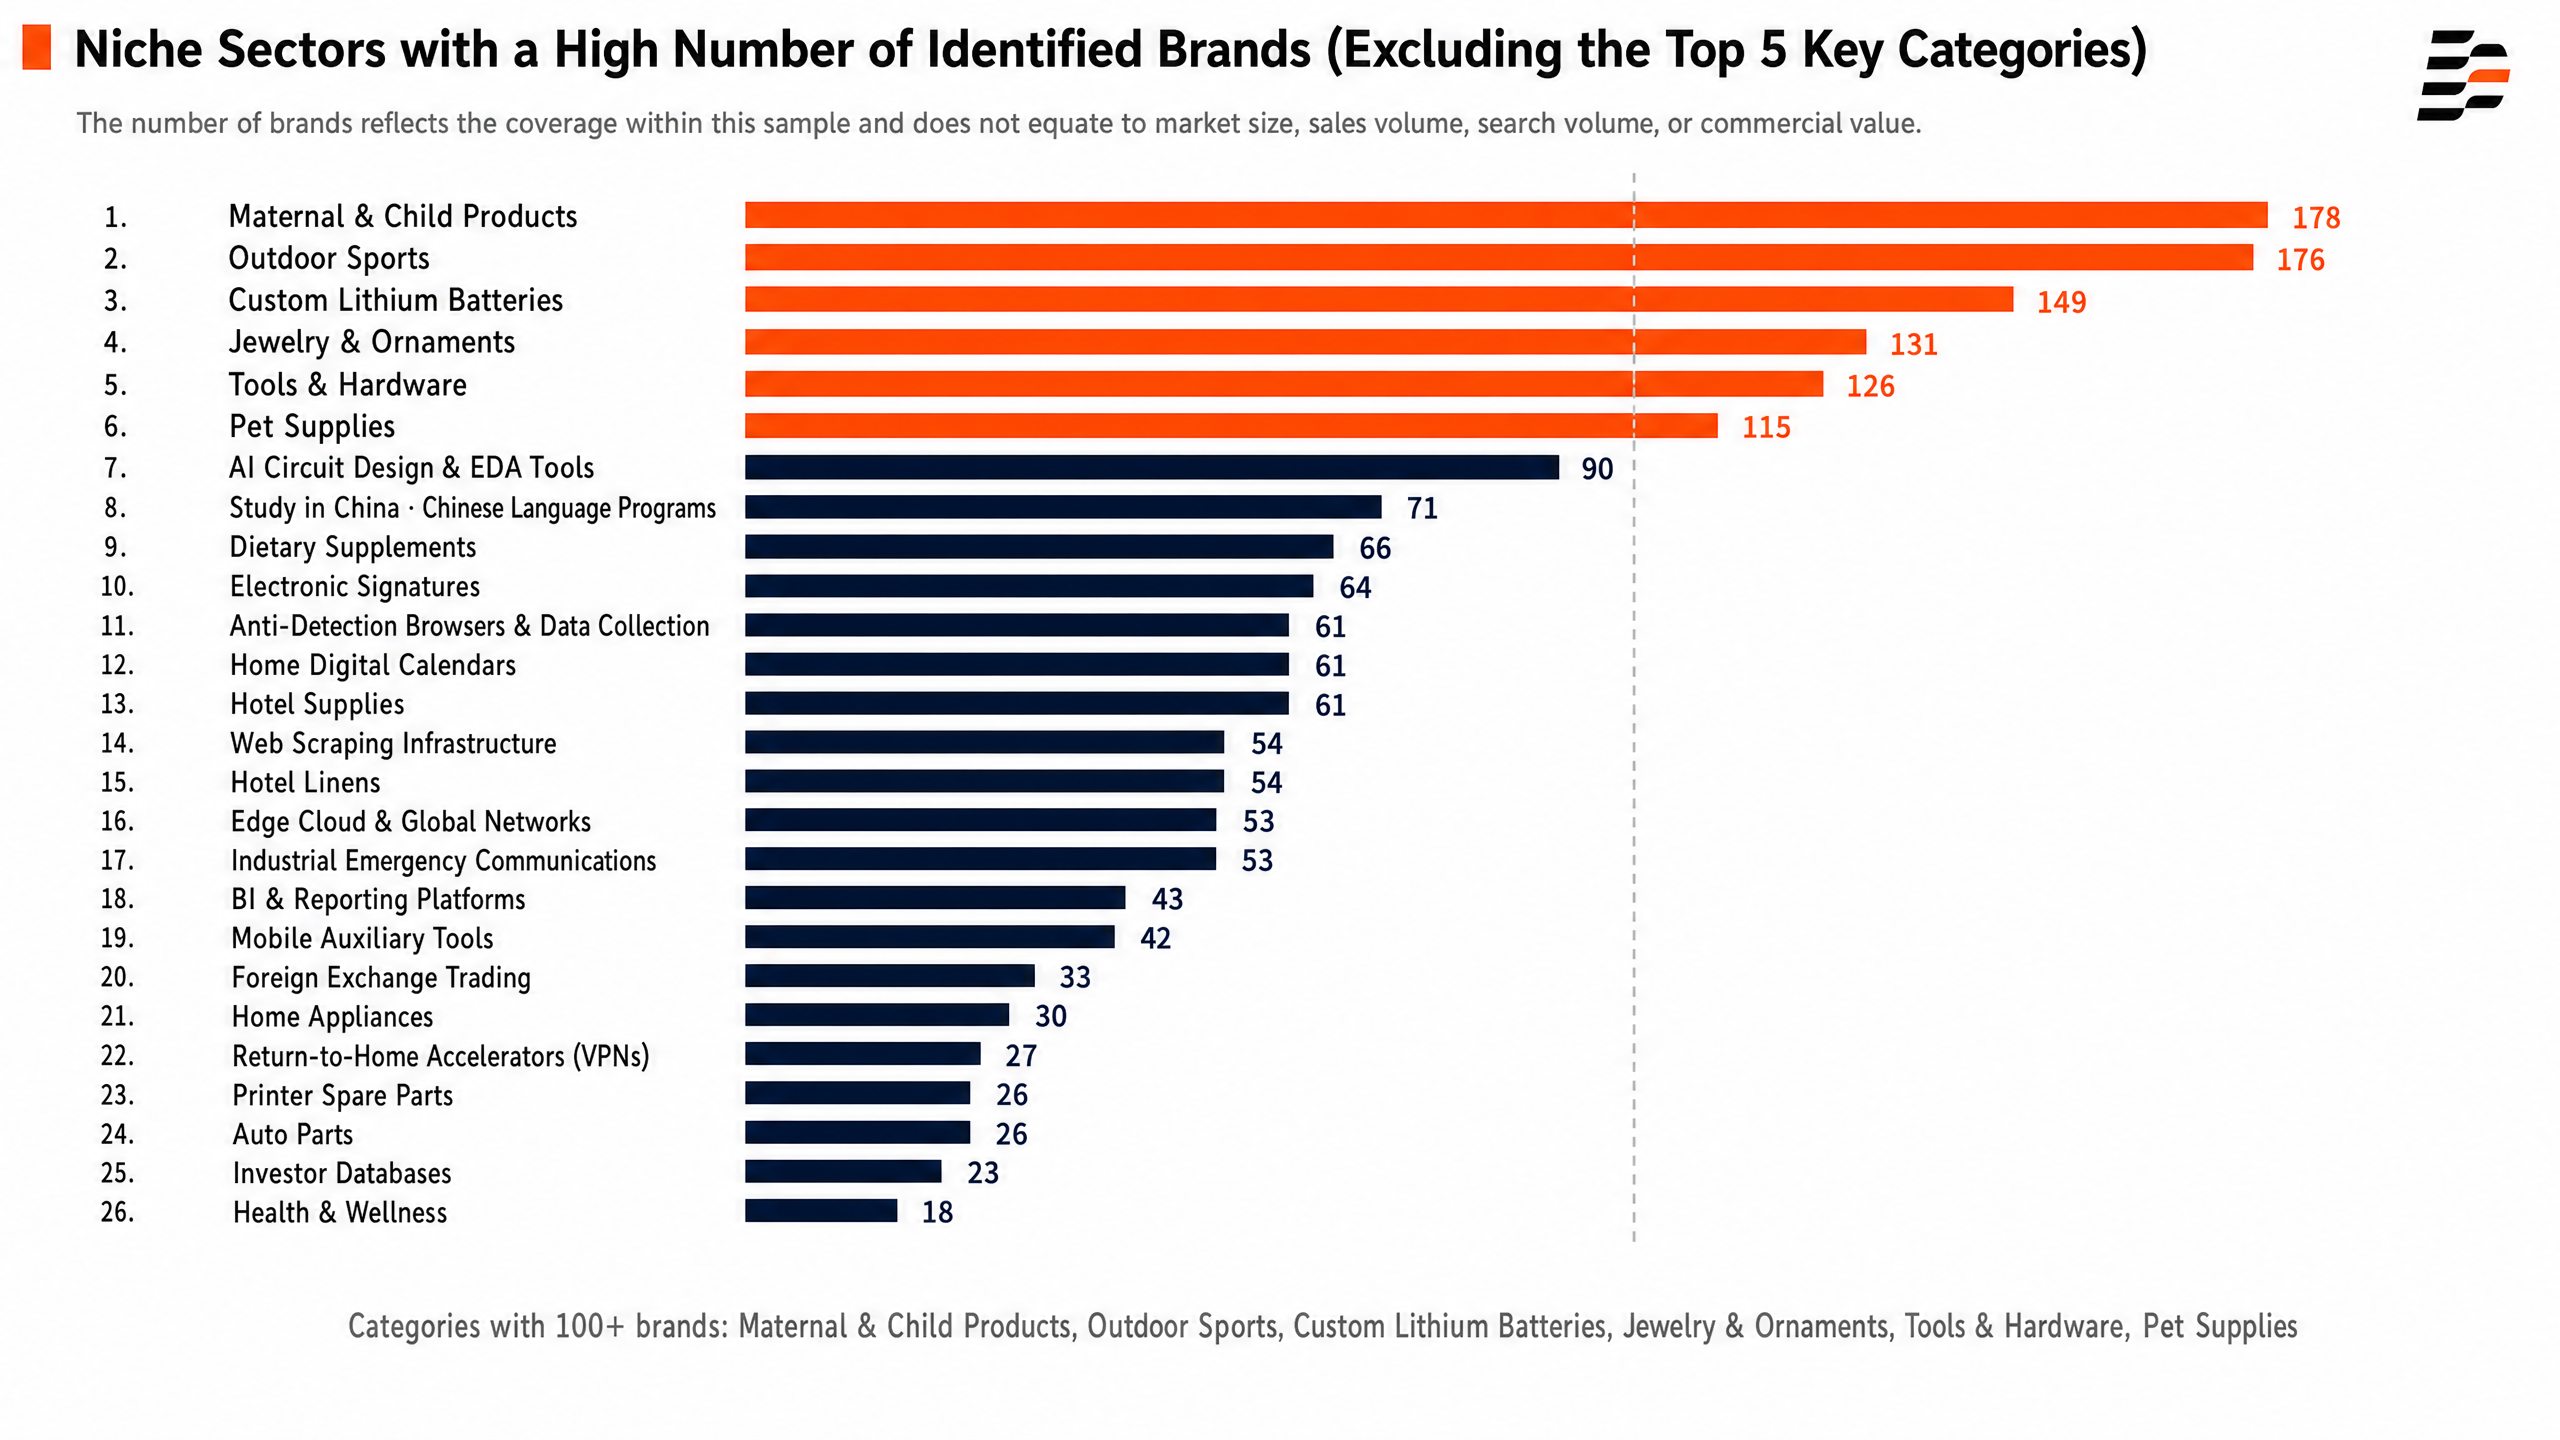
Figure 9. Number of identified brands across 26 named categories beyond the five key categories.
Beyond beauty and personal care, home and home improvement, food and grocery, apparel and footwear, and consumer electronics, the AI Shopping sample covers many additional segments. Baby and maternity products (178 brands), outdoor sports (176), custom lithium batteries (149), jewelry and accessories (131), tools and hardware (126), and pet products (115) each include more than 100 identified brands, creating relatively well-developed competitive brand pools.
These categories already provide a foundation for further analysis. Unlike the five key categories, however, the current dataset mainly indicates the scale of brand identification and does not include complete product, SKU, prompt, recommendation-rationale, or channel fields. This section therefore focuses on the degree of brand participation across segments without inferring specific product-level competitive dynamics.
Mid-sized brand pools include AI circuit design and EDA tools (90 brands), study-in-China and Chinese-language programs (71), dietary supplements (66), electronic signatures (64), anti-detect browsers and data collection (61), and digital family calendars (61). These span consumer products, software tools, and service businesses. Because their industry characteristics differ significantly, brand counts primarily indicate the range of brands appearing in the sampled AI answers; they do not directly represent market size or commercial value.
Professional fields such as web-scraping infrastructure (54 brands), edge cloud and global networking (53), industrial emergency communications (53), and BI and reporting platforms (43) currently have smaller brand pools. Even so, when user needs are highly specific and decision criteria remain stable, AI may still form a defined candidate set around professional capabilities. Future analysis should validate this by incorporating specific prompts, product information, and cited sources.
6. Conclusion: The Unit of Competition in AI Shopping Is Shifting Toward “Scenario × Attribute × SKU”
Product-level data from the five key categories shows that brand rankings explain who is more likely to enter the consideration set. Apparel and consumer electronics achieve highly concentrated placements through multiple models. Home is characterized by fragmented competition among project-specific SKUs. Beauty and food sit between the two, with both multi-SKU brand portfolios and granular attributes shaping visibility.
The second major shift is that subcategories reorganize the competitive landscape. Deodorants, fragrances, and body care in beauty; bathroom tiles, office furniture, and lighting in home; condiments and snacks in food; hiking boots, training shoes, and work shoes in apparel; and wearables, gaming, storage, and smart home products in consumer electronics all create brand combinations that differ from their parent-category rankings.
Third, once users enter the transaction stage, AI needs more than content—it needs verifiable product evidence: prices, inventory, channels, specifications, ingredients, conditions of use, compatibility, versions, and reviews. Only when these fields remain consistent across product pages, structured data, and third-party channels can a brand move from being mentioned to being selected.
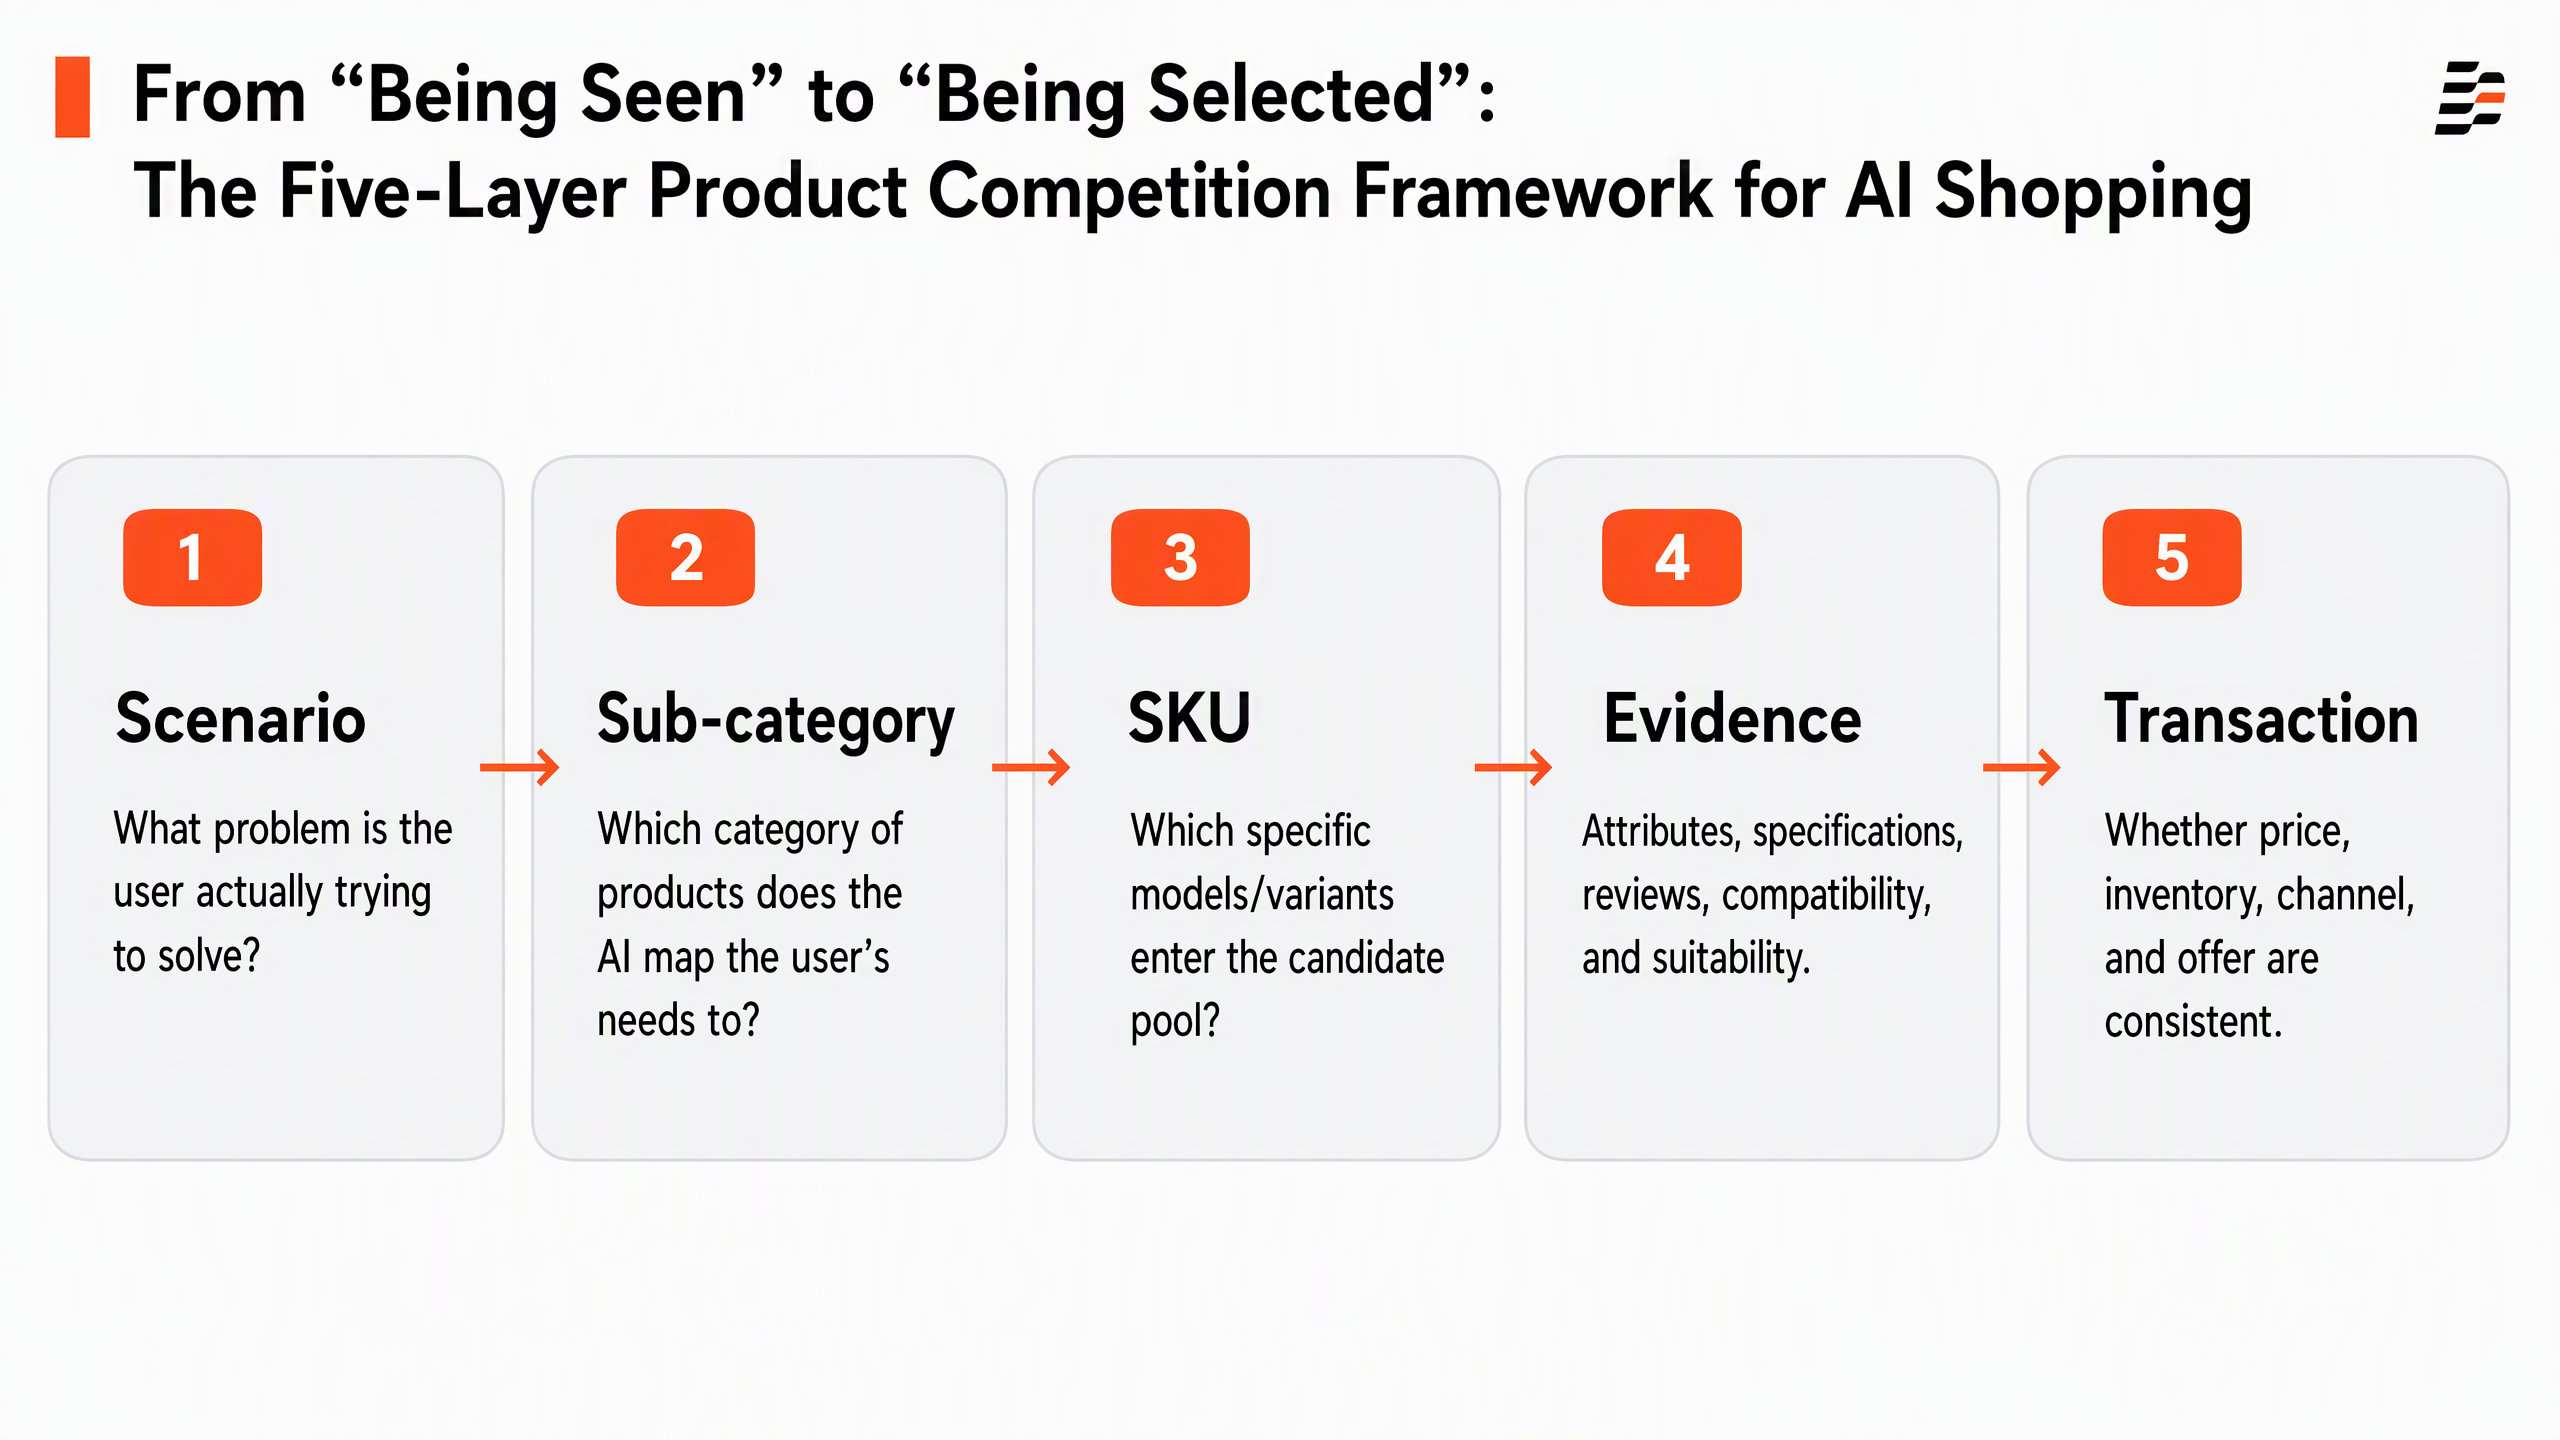
Figure 10. A five-layer product competition framework for AI Shopping, from scenario understanding to transaction completion.
If you are also working on international direct-to-consumer websites, content growth, or AI Search, feel free to connect and exchange ideas with us on WeChat: dudulhc.
About the Author

Updated by
Dageno
Dageno is the research and insights team at Dageno AI, publishing industry reports and expert analysis on AI Search Visibility, Generative Engine Optimization (GEO), and AI-powered search discovery.
Related Articles
How Can One Podcast Be Turned into 30 Video Assets That Keep Generating Leads?
Dageno • Jul 17, 2026
We Built an Intent Diagnostic Dashboard for the Content Problems GSC Can’t Reveal
Dageno • Jul 17, 2026
AI Shopping Is Rewriting Product Discovery: Cross-Border E-commerce Brands Need to Understand the New Rules First

Tim • Jun 18, 2026
GEO ranks first in the industry, yet there is almost no AI-referred traffic in the backend—why?
Tim • Jul 10, 2026